|
Introduction
Among the most common chronic non-communicable diseases worldwide, hypertension is increasingly becoming a matter of medical and public health importance. It is a preventable disease whose outcomes and complications may be decreased by implementing and improving healthy lifestyle habits.1 It is defined as a systolic blood pressure (SBP) of >140 mmHg or a diastolic blood pressure (DBP) of >90 mmHg. Stage one hypertension is defined as SDP ranging between 140 and 159 mmHg or DBP of 90 to 99 mmHg, while stage two hypertension is characterized by a SBP of ≥160 mmHg, or a DBP of ≥100 mmHg.2 The Joint National Committee-7 defines the term ‘Pre-hypertension’ as a SBP ranging between 120 and 139 mmHg or a DBP ranging between 80 and 89 mmHg. Blood pressure readings are based on two or more measurements at every two or more clinic visits. When systolic and diastolic blood pressure readings fall in two different categories, the category with the highest blood pressure is applied.2
Since the introduction of the term pre-hypertension by JNC-7 in 2003, a number of studies have attempted to estimate the prevalence of pre-hypertension among different populations and most of these studies found the widespread of pre-hypertension to be a significant health problem among the populations, particularly the adult groups but the primary causes of the inconsistency seen between countries were not proven. However, some cardiovascular risk factors such as being overweight, obesity and high blood glucose are thought to be significantly associated with pre-hypertension, while lifestyle, dietary habits and genetic factors are considered to be precipitating factors.
A cross sectional analysis of the National Health and Nutrition Examination Survey (NHANES) cohort study in the United States showed approximately 31% of the population to be affected with pre-hypertension with no apparent difference in terms of race or ethnicity. The results showed that the condition predominantly affects males than females (40% vs. 23%), and pre-hypertension was less common among subjects aged 60 years and above compared to younger individuals. This suggest that perhaps the majority of the elderly population may have already progressed to clinical hypertension.3
In addition, a national cross sectional survey conducted in Iran (Middle East) concluded that 52% of the population aged 25 - 65 years had pre-hypertension. Again, the results showed that males were most commonly affected than their female counterparts (60% vs. 45%); while in both genders, age was associated with the prevalence of pre-hypertension.4 In China, a national cross sectional survey found 22% of the adult population to have pre-hypertension and the prevalence was 26% and 18% for men and women, respectively. The prevalence of pre-hypertension was reported to be similar in both rural and urban areas.5
To date, very little is known about pre-hypertension among the population in the Sultanate of Oman. A community cross- sectional study examined the prevalence of pre-hypertension in a prediabetic Omani group, and the results revealed presence of pre-hypertension among 54% of the prediabetic group.6 Hence, the current cross-sectional study was designed to determine the prevalence and determinants of pre-hypertension among the overall Omani population.
Methods
The target population used for the national screening program included all Omanis aged 40 years or above not previously diagnosed with diabetes mellitus, hypertension or chronic kidney diseases (CKD),7 who attended the primary care institutions in Sohar city, including the three health centers. The program was based on institutional catchment area policy. This means each primary healthcare institution has its own catchment population, where each participant should report to. Individuals with previous diagnosis of diabetes, hypertension, CKD or aged under 40 years were excluded since they would already be in the stream of medical services. Most participants were from the community and they were invited through three main routes: i) community visits through community leaders; for example, the Omani Women’s Association and Community Health Supporting Groups; ii) health facilities and institutions issuing and distributing leaflets, posters and conducting lectures for medical staff as well as patients; and iii) use of other sectors such as schools, media, newspapers and Mosques to participate in the program.
Each participant had a special medical record for the national screening program and was registered at the nearest health institution. All participants were given a full explanation of the program and permission was taken before the study commenced. All required tests were explained along with their diagnosis and follow-up procedures. Contact details of each participant were well documented for future contact. Data recording varied between the health institutions because some institutions are still using manual records while others used computerized systems. However, in both cases, all records and investigations were saved in the medical records section at each primary healthcare institution. Variables including demographics, physical and metabolic characteristics are shown in Table 1. Ethical approval was granted by the health authority of Sohar city.
The criteria for normotension, pre-hypertension and hypertension applied in the current study were consistent with the definitions set by the JNC-7 report, where normal blood pressure was defined as SBP <120 mmHg and DBP <80 mmHg; While pre-hypertension was defined as SBP of 120 - 139 mmHg or DBP of 80 - 89 mmHg; and hypertension was defined as SBP ≥140 mmHg or DBP ≥90 mmHg.2
In the current study, body mass index was recognized as the measure of overall obesity and the criteria for underweight, desirable weight, overweight, obesity and morbid obesity were based on body mass index (weight/height2 [kg/m2]) and were consistent with the definitions described by the World Health Organization as follows: underweight <18.5; desirable weight ≥18.5 - 24.9; overweight ≥25 - 29.9; obesity ≥30 - 39.9; morbid obesity ≥40.8
The criteria for DM classification were applied based on the WHO consultation report which recommended that the diagnostic criteria for diabetes should be maintained as fasting blood glucose (FBG) level of ≥7.00 mmol/l, and determined impaired blood glucose (IFG) to range from ≥5.6 - 6.9 mmol/l, as well assessing the unlikely diagnosis of diabetes to be <5.5 mmol/l.9 Meanwhile, total blood cholesterol was classified as normal total blood cholesterol of <5.2 mmol/l (<200 mg/dl) and high total blood cholesterol of ≥5.2 mmol/l (≥200 mg/dl).10 Definition of chronic kidney disease was based on eGFR <90 ml/minute/1.73 m2.11
Data analyses were performed using SPSS database (PASW Statistics GradPack 18: SPSS for Windows computer package, United States). Descriptive analyses were applied to describe the demographic, physical and metabolic characteristics of the study population. The mean and standard deviation were used to describe the continuous outcome variables, while frequencies and percentages were used to represent the categorical outcome variables. The study population was further analyzed to determine the differences between normotensive, pre-hypertensive and hypertensive groups based on the given characteristics and risk factors. Furthermore, the chi-squared test and the indepent t-test were used to describe categorical outcomes (demographic, physical and metabolic characteristics) and continuous variables (metabolic characteristics), respectively. Multinomial logistic regression was performed to assess the significant determinants of pre-hypertensive and hypertensive status, with pre-hypertension or hypertension serving as the dichotomous outcome variable (pre-hypertension or hypertension vs. normotension) and age, body mass index, fasting blood glucose and total blood cholesterol as the independent predictor variables. Statistical significance was set at p<0.05.
Results
A total of 1,498 patients seen between July 2006 and December 2007 were enrolled into the study. The demographic, physical and metabolic characteristics of the study population are shown in Table 1. The results showed that the male participants were generally older than their female counterparts, while a majority of the study population was from the local community as opposed to referrals from and within the health institutions (69% vs. 31%). Another observation was that approximately 76% of the participants were from urban areas, this may be because urban areas tend to have easier access to health services compared to rural areas where there is limited accessibility to health services, and poor roads and transport services form a major obstacle.
The results also showed females to have had higher mean BMI compared to males, and of the total study population, approximately 73% participants were overweight, obese or morbidly obese. In terms of fasting blood sugar (FBS), men had a higher mean of FBS compared to women (5.9 mmol/l vs. 5.7 mmol/l), while the mean total blood cholesterol was the same for both men and women. Similarly, there were no differences in the mean systolic and diastolic blood pressure values, which were equal in all three blood pressure groups. However, the mean eGFR was above normal in the total study population and among females, while men were at the borderline of the normal range. Of the total studied group, 45% (95% CI: 0.422 - 0.473) were found to have pre-hypertension, while approximately 21% had normal blood pressure and 34% had hypertension (Fig. 1). Furthermore, the results revealed pre-hypertension to be more common among men compared to women (46% vs. 44%). (Fig. 2)
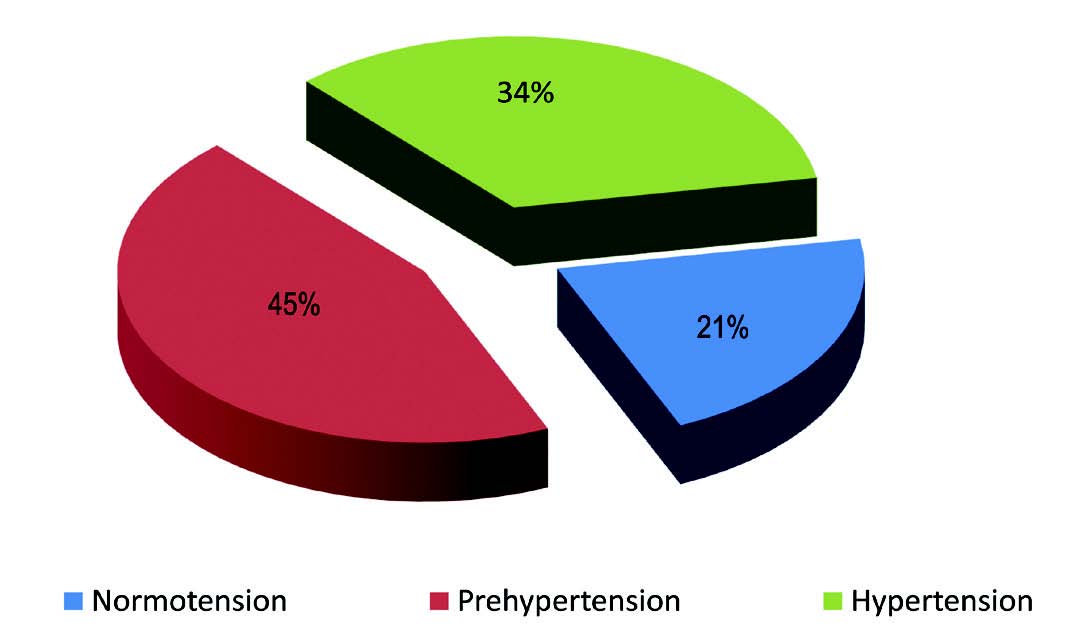
Figure 1: Prevalence of normal blood pressure, pre-hypertension and hypertension among the total study population. (n=1498)
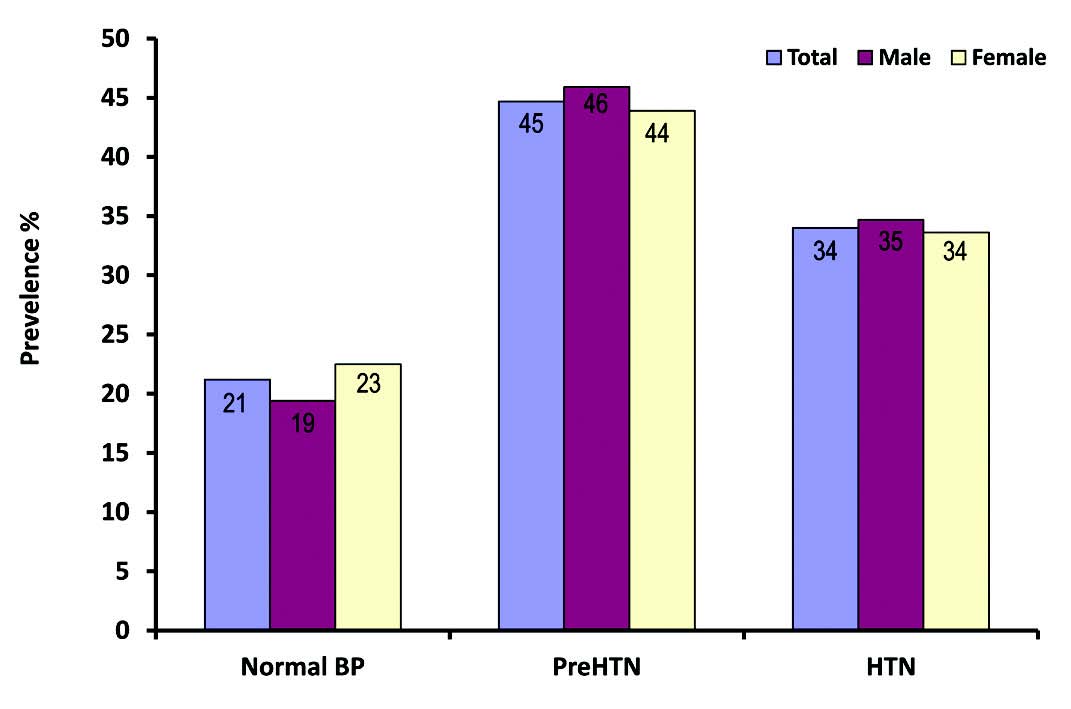
Figure 2: Prevalence of normal blood pressure, pre-hypertension (PreHTN) and hypertension (HTN) among the study population stratified by gender (n=1498).
Table 2 and 3 show the demographic and family history of the study participants in the normotensive, pre-hypertensive and hypertensive groups. The hypertensive group was generally older than the pre-hypertensive group with age ranging between 40 and 60 years, thus age was significantly associated with both pre-hypertension and hypertension (p=0.003 and p<0.001, respectively). There was no strong association between the blood pressure groups and gender; however, pre-hypertension was highly expressed among males compared to their female counterparts in the same category (46% vs. 44%). The difference in the type of residency occupied by participants of all three blood pressure groups was minimum and insignificant. Moreover, marital status was not found to be a significant characteristic among any of the three blood pressure groups.
A number of family histories were investigated in the current study; however, only family history of diabetes was observed to be a weak significant finding in the hypertensive group. None of the examined family histories were significant with the pre-hypertensive group (Table 4). Also, the metabolic and physical characteristics of normotensive, pre-hypertensive and hypertensive participants classified as risk factors for cardiovascular disease are illustrated in Table 4 using the chi-squared test. The results revealed that a large proportion of participants who were underweight had normal blood pressure, while the pre-hypertensive group included a larger proportion of participants with normal body mass index, as well as overweight and obese subjects compared to the normotensive group. Moreover, the hypertensive group was mostly composed of morbidly obese participants. Overall, body mass index was shown to be a significant feature in both the pre-hypertensive and hypertensive groups (p=0.001 and p<0.001, respectively).
Prediabetes and diabetes were mostly expressed in the pre-hypertensive group compared to the normal blood pressure group. Similarly, participants comprising the hypertensive group exhibited a higher tendency for diabetes compared to those in the normotensive group. A significant association was observed between blood glucose and both the pre-hypertensive (p=0.03), as well as the hypertensive (p<0.001) groups. Furthermore, participants with hypertension exhibited higher total blood cholesterol levels compared to those with pre-hypertension, while total blood cholesterol was significantly associated with both pre-hypertension and hypertension groups (p=0.05 and p=0.003, respectively). Although eGFR was used as an indicator of chronic kidney disease stages, it was found to be an insignificant feature in all three blood pressure groups despite the fact that stage 1 and 2 chronic kidney disease were mostly seen in the pre-hypertensive group. In contrast, patients with stage 3 and 4 chronic kidney disease were highly represented in the hypertensive group.
The metabolic and physical variables (BMI, FBS, total blood cholesterol and eGFR) of the normotensive, pre-hypertensive and hypertensive groups were further analyzed and the results are shown in Table 5. With the exception of eGFR, all the other variables including BMI, FBG and total blood cholesterol were significantly correlated with the pre-hypertensive and hypertensive groups compared to the normotensive group. Patients categorized as pre-hypertensive had a higher mean BMI compared to patients with normal blood pressure; however, a comparison of the mean BMI between the hypertension and pre-hypertension groups revealed a minimal difference.
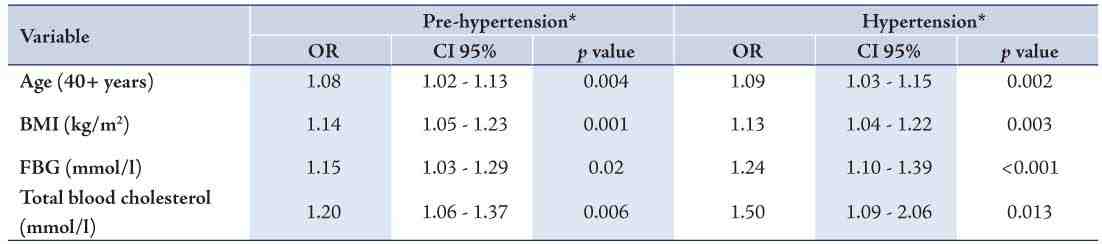
Mean fasting blood glucose (FBG) levels were generally higher among pre-hypertensive patients compared with patients categorized to have normal blood pressure. A significant difference was found between mean FBG and pre-hypertension as well as hypertension (p<0.001). Higher mean total blood cholesterol was expressed in the hypertension group compared with both the normotensive and pre-hypertensive groups. On the other hand, all three blood pressure groups expressed a mean eGFR greater than 90 ml/minute/1.73 m2. All significant demographic, physical and metabolic characteristics (age, BMI, FBG, and total cholesterol) were further analyzed using a multi-nomial logistic regression analysis in order to assess their degree of association with the normotensive, pre-hypertensive and hypertensive groups. Table 6 shows the odds ratio and the 95% confidence interval. The Hosmer and Lemeshow Test was not significant, thus indicating that the model was a good fit for the data.
As shown in Table 6, for each increased unit of the variables, there is a percentage increase in either pre-hypertension or hypertension. That is to say, for each increase of one year, there is an 8% increase in pre-hypertension (95% OR: 1.02 - 1.13) and 9% increase in hypertension (95% OR: 1.03 - 1.15). Total blood cholesterol was found to be the most significant feature for both pre-hypertension and hypertension compared to the other variables. Hence, a 20% increase in the risk of pre-hypertension (95% OR: 1.06 - 1.37) and a 50% increase in the risk of hypertension (95% OR: 1.09 - 2.06) was observed for every unit (mmol/l) increase in total blood cholesterol.
Table 1: Demographic, physical and metabolic characteristics of the participants (descriptive statistics). (n=1498)
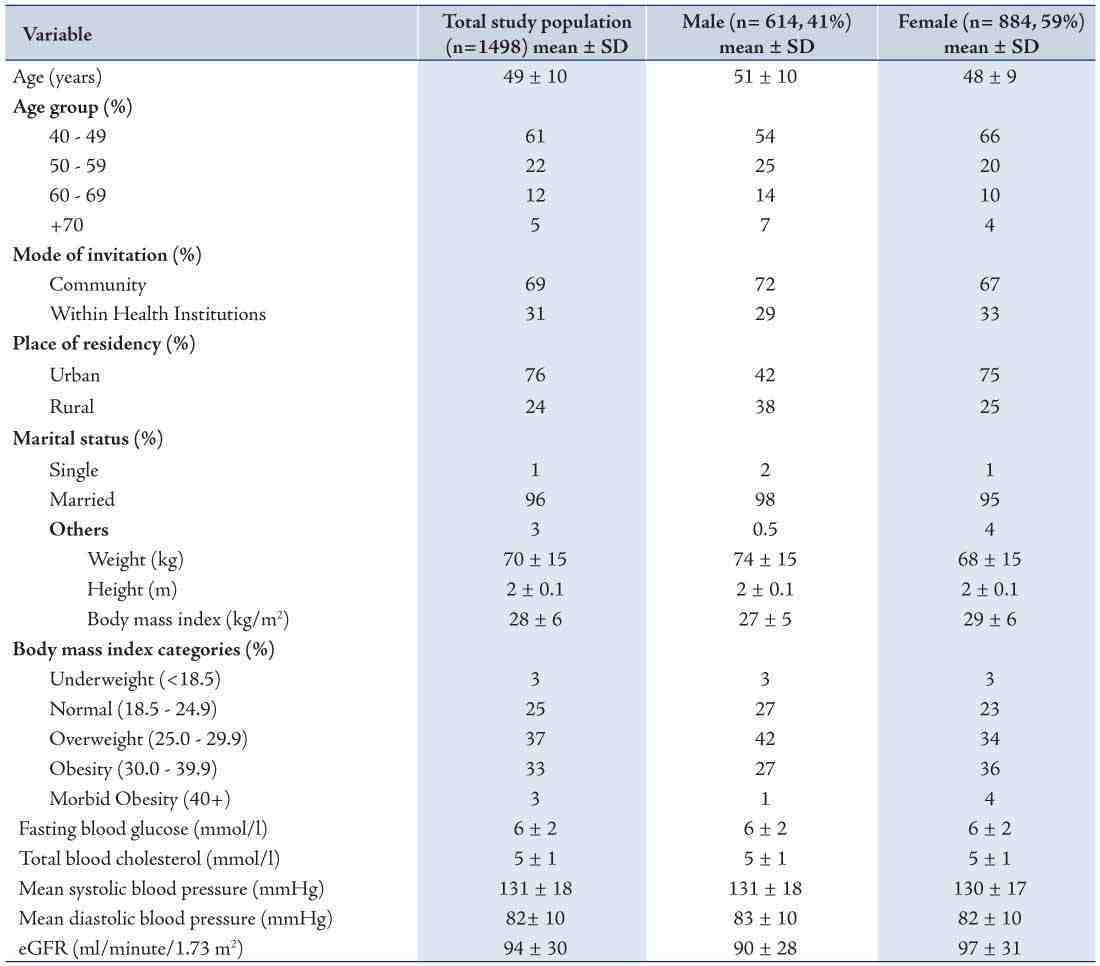
Table 2: Demographic characteristics of normotensive, pre-hypertensive and hypertensive study participants (n = 1498). (Chi-squared test)
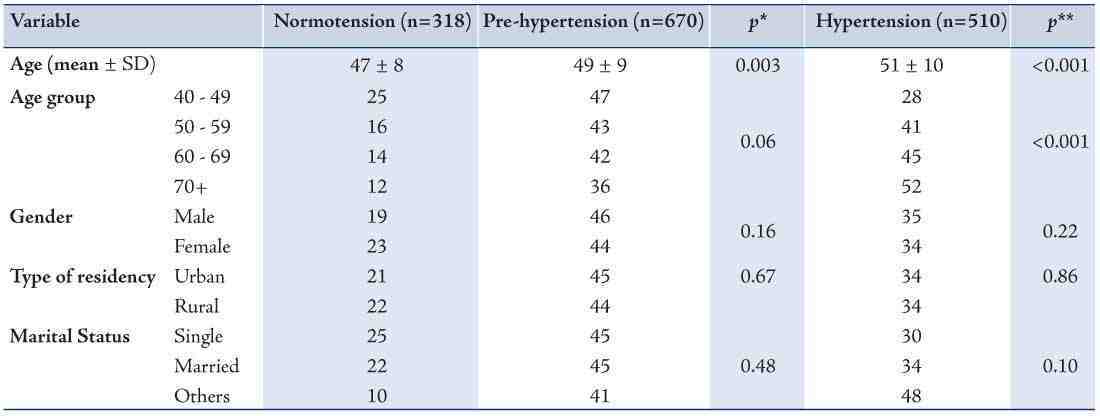
Table 3: Family history of normotensive, pre-hypertensive and hypertensive study participants (n = 1498). (Chi-squared test)
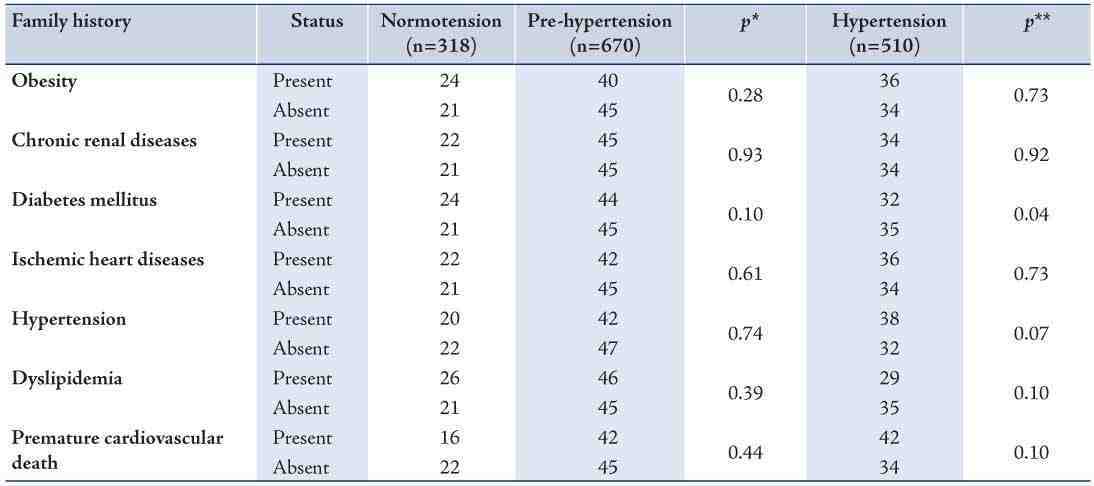
Table 4: Metabolic and physical parameters of normotensive, pre-hypertensive and hypertensive study participants (n = 1498). (chi-square test)
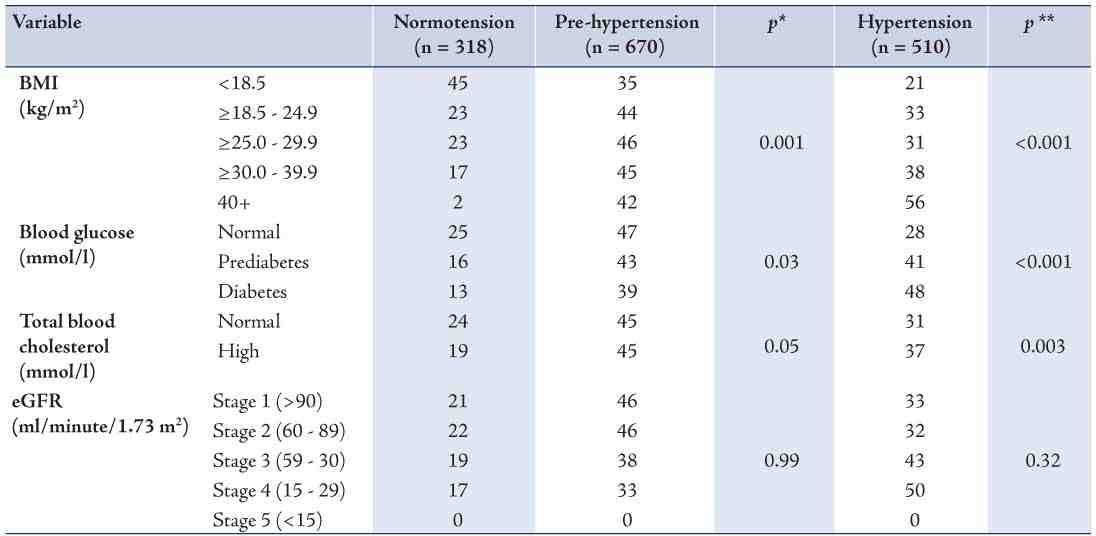
Table 5: Metabolic and physical parameters of normotensive, pre-hypertensive and hypertensive study participants (n = 1498). (t - test)
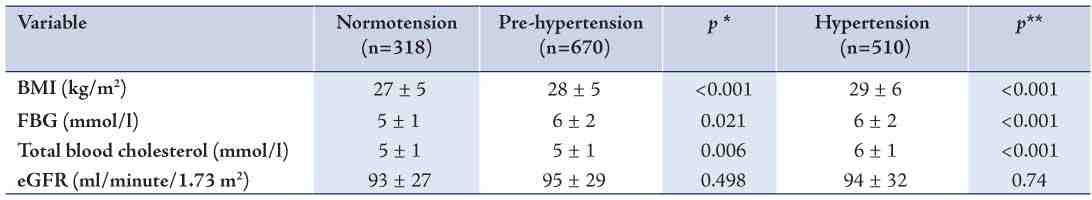
Table 6: Determinants of pre-hypertensive and hypertensive participants (n=1498). (Multi-nomial analysis).
Discussion
In this study of 1498 subjects, (614 [41%] males and 884 [59%] females), pre-hypertension was observed in 45% of the total study population. The results indicate that males were most commonly affected than females (46% vs. 44%), (Fig. 1). This finding is consistent with findings from a national cross sectional survey in Iran which concluded that 52% of the total study population had pre-hypertension and more males were affected than females (60% vs. 45%).4 The cross sectional analysis of the National Health and Nutrition examination Survey (NHANES) cohort study in the United States estimated that 31% of the population was pre-hypertensive and men were affected to a greater extent than women (40% vs. 23%).12
In the current study, hypertension was manifested in 34% of the participants (35% males and 34% females), a finding which concurs with earlier studies conducted among this particular population. The prevalence of hypertension among the Omani population has increased from 27% in 1995 to 32% in 2000.13 In the current study, only 21% of the studied patients had normal blood pressure, andpre-hypertension is shown to be a common disease among the studied group (45%). This finding may not be so surprising given the current increase in the prevalence of chronic diseases and their related risk factors in the sultanate of Oman; of which, approximately 75% of the disease burden is attributable to non-communicable diseases. Moreover, the distribution of chronic diseases raises a serious alarm that the Sultanate may be facing an epidemic of chronic non-communicable diseases.13
As the results outline, pre-hypertension was common among young adult compared to hypertension which was more common with the older age group (Table 2). Similar results were reported in earlier studies conducted in China,5 and the United States.3 This may be due to the fact that the older population has already progressed to clinical hypertension. There was very little difference in the prevalence of pre-hypertension between urban and rural areas, and no significant association was correlated with either pre-hypertension or hypertension (Table 2); the rapid increase in socioeconomic status affecting healthy lifestyles could be one explanation for this finding, but genetic factors among the population could also be another possible explanation. A similar has been reported by the national Chinese survey, where the prevalence of pre-hypertension was similar in both urban and rural areas.5
In addition, none of the variables of family history were significant in determining the prevalence of pre-hypertension (Table 3), thus indicating that an individual may develop pre-hypertension with or without a family history of hypertension, diabetes or cardiovascular diseases. As highlighted in Table 3, patients with a family history of hypertension, diabetes or cardiovascular diseases are at a similar risk of developing pre-hypertension as patients without a family history. Surprisingly however, a family history of diabetes was significantly correlated with hypertension. (Table 3)
High BMI was associated with the prevalence of pre-hypertension in the current study. Another observation was the high frequency of pre-hypertension and hypertension among overweight and obese patients compared to patients with normal blood pressure. The results also imply that hypertension was most common among morbidly obese subjects (Table 4). The prevalence of overweight and obesity in the Omani population stands at 30% and 20%, respectively.13 This high prevalence of both overweight and obese subjects may in turn lead to a greater prevalence of pre-hypertension and subsequently hypertension; which also leads to an increase in clinical complications and cardiovascular diseases (CVD).
Pre-hypertension was common among patients with high blood glucose and high blood cholesterol this study also (Table 5), most likely because pre-hypertension is associated with a high prevalence of other cardiovascular risk factors.6,14 Hypertension was similarly common among patients categorized as having high blood glucose and high blood cholesterol. Thus, suggesting that both pre-hypertension and hypertension are associated with other cardiovascular risk factors. The multi-nomial logistic regression revealed a strong correlation between pre-hypertension with overweight, obesity, high fasting blood glucose, and high total blood cholesterol (Table 6). Hypertension was also associated with the conditions. This association is consistent with the findings of other studies.4 The aggregation of these risk factors predisposes pre-hypertensive patients to metabolic syndrome and increases the development of CVD. A study conducted on Japanese individuals found the prevalence of metabolic syndrome i n the pre-hypertensive group to be higher than in subjects with normal blood pressure, but lower than in subjects with hypertension.15
The coexistence of pre-hypertension with the above mentioned risk factors is a phenomenon of clinical importance requiring prompt medical attention. This study emphasizes the need for medical practitioners to update their clinical practice skills in order to identify high risk cases by closely examining for the presence of pre-hypertension along with other risk factors. Moreover, a high prevalence of pre-hypertension is a profound finding and has important implications for the prevention strategies of chronic diseases, which may facilitate the modification of current practice and help towards building a cost-effective primary healthcare service. A number of limitations confounded this study, however. namely, the study design being cross sectional made it difficult to assess the risk factors. Also data were collected from patient files and therefore cannot generalize and apply the findings of this study to the whole community.
Conclusion
Overall, the results of the current study communicates the common widespread of pre-hypertension among the Omani adult population. Moreover, the determinants of pre-hypertension were found to be age, high BMI, high fasting blood glucose and high total blood cholesterol. Therefore, this should prompt community campaigns directed towards increasing people’s awareness of the health implications along with prevention strategies. We recommend the formulation of a cost-effectiveness study focusing on managing pre-hypertension at primary healthcare institutions to prevent signs and symptoms developing into end stage complications which would aid the implementation of future health plans to address primary healthcare aims and objectives. A follow-up assessment of patient outcomes over longer periods of time would then determine the quality of the current health programs.
Acknowledgements
The authors reported no conflict of interest and no funding was received for this work.
References
1. Kearney PM, Whelton M, Reynolds K, Muntner P, Whelton PK, He J. Global burden of hypertension: analysis of worldwide data. Lancet 2005 Jan;365(9455):217-223.
2. Chobanian AV, Bakris GL, Black HR, Cushman WC, Green LA, Izzo JL Jr, et al; National Heart, Lung, and Blood Institute Joint National Committee on Prevention, Detection, Evaluation, and Treatment of High Blood Pressure; National High Blood Pressure Education Program Coordinating Committee. The Seventh Report of the Joint National Committee on Prevention, Detection, Evaluation, and Treatment of High Blood Pressure: the JNC 7 report. JAMA 2003 May;289(19):2560-2572.
3. Wang Y, Wang QJ. The prevalence of prehypertension and hypertension among US adults according to the new joint national committee guidelines: new challenges of the old problem. Arch Intern Med 2004 Oct;164(19):2126-2134.
4. Janghorbani M, Amini M, Gouya MM, Delavari A, Alikhani S, Mahdavi A. Nationwide survey of prevalence and risk factors of prehypertension and hypertension in Iranian adults. J Hypertens 2008 Mar;26(3):419-426.
5. Yu D, Huang J, Hu D, Chen J, Cao J, Li J, et al. Prevalence and risk factors of prehypertension among Chinese adults. J Cardiovasc Pharmacol 2008 Oct;52(4):363-368.
6. Ganguly SS, Al-Shafaee MA, Bhargava K, Duttagupta KK. Prevalence of prehypertension and associated cardiovascular risk profiles among prediabetic Omani adults. BMC Public Health 2008;8:108-115.
7. Department of Surveillance and Non-Communicable Diseases Control (DSNCDC) (2006). Outlining the proposed National Health Screening for some Non-Communicable (chronic) Diseases (Diabetes Mellitus, Hypertension, Obesity and Chronic Renal Impairment). Department of Surveillance and Non-Communicable Diseases Control, Ministry of Health, Directorate General of Health Affairs, Sultanate of Oman.
8. World Health Organization (WHO) Consultation on Obesity. (2000). Obesity: Preventing and managing the global epidemic. WHO Technical Report Series 894. Geneva: World Health Organization. Accessed on: 20th June 2009, Available from: http://whqlibdoc.who.int/trs/WHO_TRS_894.pdf
9. World Health Organization (WHO). (2006). Definition and Diagnosis of Diabetes Mellitus and Intermediate Hyperglycemia: Report of WHO/IDF consultation. Geneva: World Health Organization. Accessed on: 20th June 2009, Available from www.idf.org/.../WHO_IDF_definition_diagnosis_of_diabetes.pdf
10. NHLBI. (2002). Third Report of the National Cholesterol Education Program (NCEP) Expert Panel on Detection, Evaluation, and Treatment of High Blood Cholesterol in Adults (Adult Treatment Panel III): final report. National Cholesterol Education Program. National Heart, Lung, and Blood Institute (NHLBI). National Institutes of Health. NIH Publication No. 02-5215 Accessed on 20th June 2009, Available from: http://www.nhlbi.nih.gov/guidelines/cholesterol/atp3full.pdf
11. National Kidney Foundation. K/DOQI Clinical Practice Guidelines for Chronic Kidney Diseases: Evaluation, classification, and stratification. Am J Kidney Dis 2002;39(2):1-266.
12. Greenlund KJ, Croft JB, Mensah GA. Prevalence of heart disease and stroke risk factors in persons with prehypertension in the United States, 1999-2000. Arch Intern Med 2004 Oct;164(19):2113-2118.
13. Al-Lawati JA, Mabry R, Jaffer MA. Addressing the Threat of Chronic Diseases in Oman. Journal of Prevention chronic diseases. 2008; 5(3).
14. Grotto I, Grossman E, Huerta M, Sharabi Y. Prevalence of prehypertension and associated cardiovascular risk profiles among young Israeli adults. Hypertension 2006 Aug;48(2):254-259.
15. Kanauchi M, Kanauchi K, Hashimoto T, Saito Y. Metabolic syndrome and new category ‘pre-hypertension’ in a Japanese population. Curr Med Res Opin 2004 Sep;20(9):1365-1370.
|