In December 2019, a report of pneumonia of unknown cause starting in Wuhan, China, was first delivered to the World Health Organization (WHO) country office. It was then reported to be caused by the COVID-19 virus, which had genetic sequencing suggestive of a link to the SARS group of viruses.1 The virus outbreak has rapidly spread worldwide. More than 5.2 million patients worldwide are affected, with more than 337 000 cases of related deaths.2* In Oman, the first affected cases were announced by the Ministry of Health at the end of March 2020.3 The current confirmed cases in Oman as of 25 May 2020 is 7770 with 36 reported deaths due to COVID-19 infection.**
Fever and respiratory symptoms such as cough and shortness of breath were the commonest presentations of the disease.4–8 Multiple comorbidities were associated with increased risk of hospitalization and poor prognosis. The commonest were diabetes mellitus, hypertension, and a history of smoking.6,8–10 Laboratory findings of high neutrophil count and lymphopenia have been associated with the infection.10–12
The role of imaging in the diagnostic workup of cases suspected to have COVID-19 has been rising, particularly in regions where reverse-transcriptase polymerase chain reaction (RT-PCR) testing was limited. The wide accessibility to chest X-rays made it the first imaging modality adopted by many centers at the triage level of COVID-19 patients and in monitoring the admitted group. It was reported that radiological findings in COVID-19 patients were observed at one to three weeks from disease onset.13 The main findings on chest radiographs were bilateral peripheral opacities.13–16
Imaging using chest radiograph and computed tomography are recommended modalities at the triage room, based on availability. The mobile chest X-ray is the simplest most available modality. Imaging for highly suspicious cases of COVID-19 is recommended to identify the baseline pulmonary status and assess for any cardiopulmonary abnormalities that may help risk stratification for clinical worsening.
In the presence of clinical worsening, imaging including computed tomography is again advised to assess the progression of COVID-19 or the presence of secondary cardiopulmonary abnormalities such as pulmonary embolism, other superimposed bacterial pneumonia, or heart failure that can be related to COVID-19 myocardial injury.17 In our institution, chest radiography is done at baseline admission and to follow admitted patients and assess for worsening symptoms.
In this study, we looked at the initial chest radiograph differences between two groups of admitted COVID-19 patients; the group requiring intubation and admission to the intensive care unit (ICU) and the group admitted in the normal admission wards. We were looking for any radiographic differences that were associated with worsening of the cases and the requirement of intubation.
We also studied the relationship between the clinical and radiographic findings among the intubated and non-intubated patients.
Methods
This was a retrospective study. All patients with confirmed COVID-19 infection, who were admitted to the Royal Hospital, Muscat, were enrolled in the study from the beginning of March to the end of April 2020. COVID-19 infection was confirmed by RT-PCR test for all patients, following our institution protocol. The patient’s biographic and laboratory data were accessed from the hospital information system (HIS) and the radiology information system (RIS). Ethical approval was obtained from the hospital ethical committee. The ethics committee waived the requirement for informed patient consent for this retrospective study.
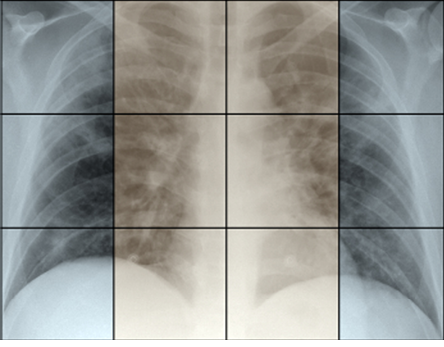
Figure 1: Chest radiographs were divided into 12 areas/zones to assess the degree of involvement. Three horizontal zones (upper, middle, and lower) divided into two vertical zones (central and peripheral).
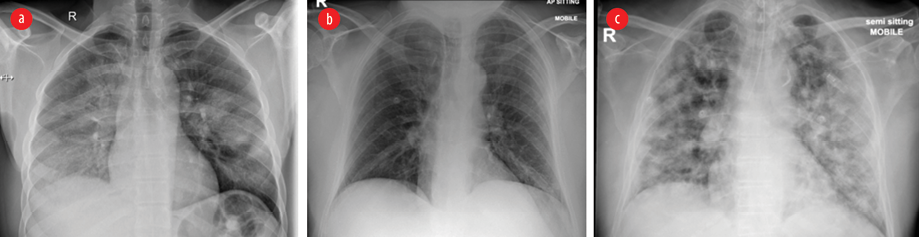
Figure 2: Chest radiograph of hospitalized COVID-19 patients. (a) Chest radiograph of a young man showing air space pattern of opacities in middle and lower zones with prominent peripheral zonal involvement. (b) Peripheral left lower zone linear pattern of opacities. (c) Multiple diffused nodular patterns of opacities in another patient who was eventually admitted to the ICU.
Two experienced cardiothoracic radiologists reviewed initial chest radiographs of all patients. Each chest radiograph was divided into 12 segments. The right (R) and left (L) lungs were divided into three horizontal zones (Z): upper (U), middle (M), and lower (L). Each lung was subdivided into two vertical zones, peripheral (P) and central (C). The results are 12 areas/zones [Figure 1]. The 12 areas were labelled: P-RUZ, C-RUZ, P-RMZ, C-RMZ, P-RLZ, C-RLZ, P-LUZ, C-LUZ, P-LMZ, C-LMZ, P-LLZ, and C-LLZ. The presence and absence of abnormality were recorded. The abnormalities were further qualified as nodular, linear, airspace, and mixed opacities [Figure 2].
The two radiologists reviewed the images independently. Any disagreement was resolved by discussion and consensus.
All data collection were obtained from the HIS and RIS. Patients demographics such as age, sex, and citizenship were collected. The recorded comorbidities included hypertension, diabetes mellitus, kidney disease, and cardiovascular diseases. Immune status and smoking history were also collected. The radiological interpretation of the 12 areas was done by the radiologist for each case. The following laboratory tests, done at the time of admission, were collected; white cell count (WBC), lymphocyte count, neutrophil cell count, neutrophil/lymphocyte ratio (NLR), C-reactive protein (CRP) level, and platelets count. Based on our institution laboratory normal values, the following was adopted as the ranges for values; CRP (reference range: < 10 mg/L, analytical sensitivity: 4 mg/L), WBC (2.4–9.5 × 10⁹/L), neutrophils count (1–4.8 × 10⁹/L), lymphocyte count (1.2–3.8 × 10⁹/L), and platelets (150–450 × 109/L).
COVID-19 confirmation test was done by RT-PCR test, which is the molecular test used for disease definite diagnosis and confirmation. The tests were done in the national virology reference laboratory using more than one kit (Liferiver, Sunsure, Cobas® SARS-CoV-2; Roche). Validation and verification of used tests were done before use. All testing runs were done with controls.
The number of days from the onset of symptoms to hospitalization was obtained. Also, the length of stay in hospital was recorded. Finally, the outcome for the patients was obtained and recorded for status, discharge, death, or continued admission. At the time of writing this article, few patients were still admitted with the outcome to be determined.
Statistical analysis was done using SPSS Statistics (IBM Corp. Released 2011. IBM SPSS Statistics for Windows, Version 20.0. Armonk, NY: IBM Corp.). Frequencies with percentages were reported for categorical data, and medians with interquartile ranges (IQRs) were calculated for contentious data. Chi-square test was considered for comparison between categorical variables, and Mann-Whitney U test was used to compare two independent samples. The difference was considered significant at p < 0.050 with a two-tailed test.
Results
A total of 26 positive COVID-19 cases were enrolled in this study in which 11/26 (42.3%) were intubated, and 15/26 (57.7%) were not intubated [Table 1]. The median age was 47.5 years [IQR of 28 and 76 years] with no statistically significant difference between intubated and non-intubated cases (p = 0.065). All the intubated cases were male (100%), and 10/11 (90.9%) were non-citizens. The majority of intubated cases had at least one of the listed comorbidities (9/11, 81.8%) compared to 6/15 (40.0%) in the non-intubated group (p = 0.051). There was a statistically significant difference in having diabetes mellitus (p = 0.020) in which 8/11 and 4/15 were recorded in the intubated and non-intubated groups, respectively.
Table 1: Clinical and laboratory characteristics of patients.
|
Age, years |
|
Median (25 and 75 IQR) |
47.5 (34.8,67) |
Max 76–min 28 |
|
|
0.065 |
|
Sex |
|
Male |
23 |
88.5 |
11 (100) |
12 (80.0) |
0.238 |
|
Female |
3 |
11.5 |
0 (0.0) |
3 (20.0) |
|
|
Citizenship |
|
Citizen |
8 |
30.8 |
1 (9.1) |
7 (46.7) |
0.084 |
|
Non-citizen |
18 |
69.2 |
10 (90.9) |
8 (53.3) |
|
|
Nasopharyngeal swabs to diagnosis, n |
|
First |
24 |
92.3 |
11 (100) |
13 (86.7) |
0.492 |
|
Second |
2 |
7.7 |
0 (0.0) |
2 (13.3) |
|
|
Smoking history* |
|
Yes |
2 |
7.7 |
1 (9.1) |
1 (6.7) |
0.709 |
|
Comorbidities |
|
Any comorbidity |
15 |
57.7 |
9 (81.8) |
6 (40.0) |
0.051 |
|
HTN |
9 |
34.6 |
5 (45.5) |
4 (26.7) |
0.419 |
|
DM |
12 |
46.2 |
8 (72.7) |
4 (26.7) |
0.020 |
|
Kidney disease |
2 |
7.7 |
0 (0.0) |
2 (13.3) |
0.492 |
|
Cardiac disease |
3 |
11.5 |
1 (9.1) |
2 (13.3) |
1.000 |
|
Immune deficient |
1 |
3.8 |
0 (0.0) |
1 (6.7) |
1.000 |
|
Presenting symptoms |
|
Respiratory symptoms |
22 |
84.6 |
9 (81.8) |
13 (86.7) |
1.000 |
|
Fever |
20 |
76.9 |
8 (72.7) |
12 (80.0) |
1.000 |
|
Cough |
13 |
50.0 |
6 (54.5) |
7 (46.7) |
0.691 |
|
SOB |
13 |
50.0 |
4 (36.4) |
9 (60.0) |
0.234 |
|
Coryzal symptoms |
7 |
26.9 |
3 (27.3) |
4 (26.7) |
1.000 |
|
Headache |
2 |
7.7 |
0 (0.0) |
2 (13.3) |
0.492 |
|
Body aches |
4 |
15.4 |
0 (0.0) |
4 (26.7) |
0.113 |
|
Fatigue |
11 |
42.3 |
3 (27.3) |
8 (53.3) |
0.246 |
|
Diarrhea |
4 |
15.4 |
2 (18.2) |
2 (13.3) |
1.000 |
|
Chest pain |
3 |
11.5 |
1 (9.1) |
2 (13.3) |
1.000 |
|
Days from symptoms to admission |
|
Median (25 and 75 IQR) |
7 days |
(5,10) days |
|
|
0.833 |
|
Parameters at admission |
|
RR > 30 |
16 |
61.5 |
8 (72.7) |
8 9 (53.3) |
0.428 |
|
Elevated WBC (> 10) |
5 |
19.2 |
3 (27.3) |
2 (13.3) |
0.620 |
|
Lymphopenia |
22 |
84.6 |
11 (100) |
11 (73.3) |
0.068 |
|
Elevated neutrophil count (> 6) |
12 |
46.2 |
6 (54.5) |
6 (40.0) |
0.462 |
|
Elevated CRP**: |
|
|
|
|
|
|
Mild |
0 |
0.0 |
0 (0.0) |
0 (0.0) |
0.099 |
|
Moderate |
11 |
42.3 |
2 (18.2) |
9 (60.0) |
|
|
Severe |
14 |
53.8 |
8 (72.7) |
6 (40.0) |
|
|
Elevated NLR |
18 |
69.2 |
10 (90.9) |
8 (53.3) |
0.044 |
|
Platelets |
|
|
|
|
|
|
Low |
1 |
3.8 |
0 (0.0) |
1 (6.7) |
0.800 |
|
Elevated |
1 |
3.8 |
1 (9.1) |
0 (0.0) |
|
|
Outcome |
|
Discharged |
13 |
50.0 |
3 (27.3) |
10 (66.7) |
0.880 |
|
Died |
8 |
30.8 |
5 (45.5) |
3 (20.0) |
|
Note:*Two cases missing (intubated cases), **One case missing
IQR: interquartile range; HTN: hypertension, DM: diabetes mellitus; SOB: shortness of breath; RR: respiratory rate; WBC: white blood cells; CRP: C-reactive protein; NLR: neutrophil to lymphocyte ratio.
The median number of days from developing symptoms to admission was seven [IQR; 5 and 10], ranging between 1 and 10 days with no significant difference between intubated and non-intubated cases (p = 0.833) [Table 1]. The majority of cases presented with respiratory symptoms 9/11 (81.8%) and 13/15 (86.7%) and fever in 8/11 (72.7%) and 12/15 (80.0%) in intubated and non-intubated cases with no statistically significant difference between the two groups. Positive RT-PCR tests for COVID-19 were seen in 24/26 of the patients from the first swab.
The NLR was elevated in 10/11 (90.9%) in the intubated group compared to 8/15 (53.3%) in the non-intubated group (p = 0.044) [Table 1]. The median value of NLR was 6.11 (IQR; 2.98 and 9.69).
The intubated cases showed more elevation in CRP level at the time of hospitalization, with 2/11 (18.2%) showing moderate elevation and 8/11 (72.7%) with severe elevation, compared to non-intubated cases with 9/15 (60.0%) moderate and 6/15 (40.0%) severe elevation. However, the differences were not statically significant (p = 0.099).
There were no differences found between the intubated and non-intubated chest X-ray findings in terms of laterality involvement, the involvement of central and peripheral zones, and lesion type [Table 2]. However, upper zones involvement was more noted in the intubated group with 10/11 (90.9%) compared to 7/15 (46.7%) in non-intubated cases (p = 0.036). In addition, there were higher numbers of zones involvement in intubated cases compared to non-intubated cases indicative of higher severity. Nine out of eleven (81.8%) intubated patients had 10-12 zones of involvement on chest radiographs compared to 3/15 (20.0%) in the non-intubated group [Table 3].
Up to the day of data analysis, 8/26 patients died, 5/11 from the intubated group, and 3/15 from the non-intubated group. A total of 13/26 were discharged home with 3/11 from the intubated group and 10/15 from the non-intubated group. Five patients included in the study were still admitted to the hospital when writing this study [Table 1].
Table 2: Chest radiographs findings in the two groups.
|
Laterality |
|
R lung |
11 (100) |
14 (93.3) |
25 (96.2) |
1.000 |
|
L lung |
11 (100) |
14 (93.3) |
25 (96.2) |
1.000 |
|
Central to peripheral distribution |
|
Central zones |
11 (100) |
14 (93.3) |
25 (96.2) |
1.000 |
|
Peripheral zones |
11 (100) |
14 (93.3) |
25 (96.2) |
1.000 |
|
Cephalocaudal distribution |
|
Upper zones |
10 (90.9) |
7 (46.7) |
17 (65.4) |
0.036 |
|
Middle zones |
11 (100) |
12 (80.0) |
23 (88.5) |
0.238 |
|
Lower zones |
11 (100) |
15 (100) |
26 (100) |
1.000 |
|
Type of lesion |
|
Linear |
0 (0.0) |
4 (26.7) |
4 (15.4) |
0.113 |
|
Nodular |
2 (18.2) |
1 (6.7) |
3 (11.5) |
0.556 |
|
Air space |
7 (63.6) |
6 (40.0) |
13 (50.0) |
0.234 |
Table 3: Chest radiographs findings for the 12 zones in the two groups.
|
Zone involvement |
|
PRUZ |
11 (100) |
7 (46.7) |
18 (69.2) |
0.007 |
|
PRMZ |
11 (100) |
9 (60.0) |
20 (76.9) |
0.024 |
|
PRLZ |
11 (100) |
12 (80.0) |
23 (88.5) |
0.238 |
|
PLUZ |
7 (63.6) |
3 (20.0) |
10 (38.5) |
0.043 |
|
PLMZ |
11 (100) |
9 (60.0) |
20 (76.9) |
0.024 |
|
PLLZ |
11 (100) |
13 (86.7) |
24 (92.3) |
0.492 |
|
CRUZ |
9 (81.8) |
5 (33.3) |
14 (53.8) |
0.014 |
|
CRMZ |
11 (100) |
9 (60.0) |
20 (76.9) |
0.024 |
|
CRLZ |
11 (100) |
13 (86.7) |
24 (92.3) |
0.492 |
|
CLUZ |
8 (72.7) |
3 (20.0) |
11 (42.3) |
0.015 |
|
CLMZ |
9 (81.8) |
8 (53.3) |
17 (65.4) |
0.217 |
|
CLLZ |
11 (100) |
11 (73.3) |
22 (84.6) |
0.113 |
|
Number of zones involved |
|
1–3 |
0 (0.0) |
4 (26.7) |
4 (15.4) |
|
|
4–6 |
0 (0.0) |
3 (20.0) |
3 (11.5) |
|
|
7–9 |
2 (18.2) |
5 (33.3) |
7 (26.9) |
|
Discussion
The COVID-19 infection outbreak was announced as a pandemic by the WHO on 11 March 2020.2 With the increasing number of affected cases, the number of admissions also rises. This also implies a rise in admission to ICU and the need for mechanical ventilation. Approximately 20% of affected cases require hospitalization and 5% require admission to ICU and mechanical ventilation.18 Imaging using chest radiograph and computed tomography are recommended modalities at the triage room, based on availability.
In this research, we studied the available chest radiographs of all admitted patients with confirmed COVID-19 infection. We compared the radiographical and clinical findings between the group of patients who were admitted to the ICU and intubated to the group of patients who remained hospitalized but without the need for intubation and ICU admission.
In our study, the male gender represents the majority of all hospitalized cases at 88.5%, and 100% among the intubated cases. Approximately one-third were citizens and two-thirds were non-citizens.
The majority of patients presented with fever, cough, and shortness of breath. The results are similar to what was previously published from other parts of the world, including Oman.4,5,13,19–21 Headache was the least presenting symptom representing 7.7%.
The radiographic findings in our group re-demonstrate the lower and basal preference of disease distribution.17,22–26 There were more areas of involvement representing worse radiographic severity in the intubated group. The majority (81.8%) of intubated patients had 10-12 areas of involvement in their chest radiographs compared to only 20.0% of the hospitalized non-intubated group.
The distribution showed that there is more peripheral involvement than central among the intubated cases. In the three horizontal zones, the right lung peripheral areas were 100% involved among the intubated group. The peripheral left upper zone (P-LUZ) was the least area of involvement among both groups.
Our study has several limitations. The first limitation is the small sample size that could affect the statistical significance measures. Further studies with a larger sample size are needed in the future. The second limitation is the study’s retrospective nature; therefore, there could be a possible effect on the measured outcome. The third limitation is that not all information, particularly about some of the patients’ outcomes, was available at the time of conduction of the study. Some of the included patients were still admitted at the time of submission for publication. The fourth limitation is that most of the information was gathered from the electronic HIS, which precluded the level and diversity of details collected.
Conclusion
The initial radiographic findings among intubated and non-intubated hospitalized COVID-19 patients demonstrate differences in the degree of lung involvement represented in the number of areas involved. Also, more upper zone involvement was noted in the intubated group at the time of admission. The other radiological findings showed no significant differences. Male sex and diabetes mellitus carried a poorer prognosis and were more associated with the intubated group. The sample size of this study was small; therefore, further studies with larger sample sizes are needed in the future to support these initial findings.
Updated numbers at the time of submission.
*There are now > 184 million patients worldwide affected, with > 3.89 million cases of related deaths.
**The current confirmed cases in Oman as of July 2021 is 276 736, with 3316 reported deaths due to COVID-19 infection.
Disclosure
The authors declared no conflicts of interest. No funding was received for this study.
Acknowledgments
We thank all teams who contributed to the care of patients with COVID-19 at our institution. Special thanks to the Infectious Disease and Intensive Care Departments.
references
- 1. World Health Organization. Coronavirus disease (COVID19) outbreak. 2020 [cited 2020 May 10]. Available from: https://www.who.int/docs/default-source/coronaviruse/situation-reports/20200121-sitrep-1-2019-ncov.pdf?sfvrsn=20a99c10_4.
- 2. WCdCZ. 2020 [cited 2020 May 10]. Available from:
https://www.who.int/emergencies/diseases/novel-coronavirus-2019.
- 3. Khamis F, Al Rashidi B, Al-Zakwani I, Al Wahaibi AH, Al Awaidy ST. Epidemiology of COVID-19 infection in Oman: analysis of the first 1304 cases. Oman Med J 2020;35(3):e145.
- 4. Yang W, Cao Q, Qin LE, Wang X, Cheng Z, Pan A, et al. Clinical characteristics and imaging manifestations of the 2019 novel coronavirus disease (COVID-19): a multi-center study in Wenzhou city, Zhejiang, China. J Infect 2020;80(4):388-393.
- 5. Kim ES, Chin BS, Kang CK, Kim NJ, Kang YM, Choi JP, et al; Korea National Committee for Clinical Management of COVID-19. Clinical course and outcomes of patients with severe acute respiratory syndrome coronavirus 2 infection: a preliminary report of the first 28 patients from the Korean Cohort Study on COVID-19. J Korean Med Sci 2020 Apr;35(13):e142.
- 6. Huang C, Wang Y, Li X, Ren L, Zhao J, Hu Y, et al. Clinical features of patients infected with 2019 novel coronavirus in Wuhan, China. Lancet 2020;395(10223):497-506.
- 7. Zhou Y, Zhang Z, Tian J, Xiong S. Risk factors associated with disease progression in a cohort of patients infected with the 2019 novel coronavirus. Ann Palliat Med 2020 Mar;9(2):428-436.
- 8. Richardson S, Hirsch JS, Narasimhan M, Crawford JM, McGinn T, Davidson KW, et al; the Northwell COVID-19 Research Consortium. Presenting characteristics, comorbidities, and outcomes among 5700 patients hospitalized with COVID-19 in the New York City area. JAMA 2020 May;323(20):2052-2059.
- 9. Chen N, Zhou M, Dong X, Qu J, Gong F, Han Y, et al. Epidemiological and clinical characteristics of 99 cases of 2019 novel coronavirus pneumonia in Wuhan, China: a descriptive study. Lancet 2020;395(10223):507-513.
- 10. Sun H, Ning R, Tao Y, Yu C, Deng X, Zhao C, et al. Risk factors for mortality in 244 older adults with COVID-19 in Wuhan, China: a retrospective study. J Am Geriatr Soc 2020 Jun;68(6):E19-E23.
- 11. Plaçais L, Richier Q. [COVID-19: clinical, biological and radiological characteristics in adults, infants and pregnant women. An up-to-date review at the heart of the pandemic]. Rev Med Interne 2020 May;41(5):308-318.
- 12. Wu C, Chen X, Cai Y, Xia J, Zhou X, Xu S, et al. Risk factors associated with acute respiratory distress syndrome and death in patients with coronavirus disease 2019 pneumonia in Wuhan, China. JAMA Intern Med 2020 Jul;180(7):934-943.
- 13. Shi H, Han X, Jiang N, Cao Y, Alwalid O, Gu J, et al. Radiological findings from 81 patients with COVID-19 pneumonia in Wuhan, China: a descriptive study. Lancet Infect Dis 2020;20(4):425-434.
- 14. Bandirali M, Sconfienza LM, Serra R, Brembilla R, Albano D, Pregliasco FE, et al. Chest X-ray findings in asymptomatic and minimally symptomatic quarantined patients in Codogno, Italy. Radiology 2020;295(3):E7.
- 15. Hosseiny M, Kooraki S, Gholamrezanezhad A, Reddy S, Myers L. Radiology perspective of coronavirus disease 2019 (COVID-19): lessons from severe acute respiratory syndrome and Middle East respiratory syndrome. AJR Am J Roentgenol 2020;214(5):1078-1082.
- 16. Jacobi A, Chung M, Bernheim A, Eber C. Portable chest X-ray in coronavirus disease-19 (COVID-19): a pictorial review. Clin Imaging 2020 Aug;64:35-42.
- 17. Rubin GD, Ryerson CJ, Haramati LB, Sverzellati N, Kanne JP, Raoof S, et al. The role of chest imaging in patient management during the COVID-19 pandemic: a multinational consensus statement from the fleischner society. Chest 2020 Jul;158(1):106-116.
- 18. WCdCo. 2020 [cited 2020 May 11]. Available from: https://www.who.int/emergencies/diseases/novel-coronavirus-2019?gclid=Cj0KCQjw24qHBhCnARIsAPbdtlIz1fVmzh-ll194UH9k1WsvQRSVmAY8150GebhsqOzPjUweko6-GckaAnUIEALw_wcB.
- 19. Xu YH, Dong JH, An WM, Lv XY, Yin XP, Zhang JZ, et al. Clinical and computed tomographic imaging features of novel coronavirus pneumonia caused by SARS-CoV-2. J Infect 2020;80(4):394-400.
- 20. Huang R, Zhu L, Xue L, Liu L, Yan X, Wang J, et al. Clinical findings of patients with coronavirus disease 2019 in Jiangsu province, China: A retrospective, multi-center study. PLoS Negl Trop Dis 2020 May;14(5):e0008280.
- 21. Khamis F, Al-Zakwani I, Al Naamani H, Al Lawati S, Pandak N, Omar MB, et al. Clinical characteristics and outcomes of the first 63 adult patients hospitalized with COVID-19: an experience from Oman. J Infect Public Health 2020 Jul;13(7):906-913.
- 22. Zhou Y, Yang GD, Feng K, Huang H, Yun YX, Mou XY, et al. [Clinical features and chest CT findings of coronavirus disease 2019 in infants and young children]. Zhongguo Dang Dai Er Ke Za Zhi 2020 Mar;22(3):215-220.
- 23. Wang J, Liu J, Wang Y, Liu W, Chen X, Sun C, et al. [Dynamic changes of chest CT imaging in patients with corona virus disease-19 (COVID-19)]. Zhejiang Da Xue Xue Bao Yi Xue Ban 2020;49(1):191-197.
- 24. Wu J, Wu X, Zeng W, Guo D, Fang Z, Chen L, et al. Chest CT findings in patients with coronavirus disease 2019 and its relationship with clinical features. Invest Radiol 2020;55(5):257-261.
- 25. Ye Z, Zhang Y, Wang Y, Huang Z, Song B. Chest CT manifestations of new coronavirus disease 2019 (COVID-19): a pictorial review. Eur Radiol 2020 Aug;30(8):4381-4389.
- 26. Pan Y, Guan H, Zhou S, Wang Y, Li Q, Zhu T, et al. Initial CT findings and temporal changes in patients with the novel coronavirus pneumonia (2019-nCoV): a study of 63 patients in Wuhan, China. Eur Radiol 2020 Jun;30(6):3306-3309.