Obesity is the most common non-communicable and public health problem in the world. The magnitudes of obesity include increased risk of developing insulin resistance (IR), cardiovascular disease (CVD), and diabetes mellitus. Previous studies revealed that billions of people suffer from obesity, among them 1.46 billion individuals are overweight, and 502 million are obese.1 Obesity is strongly associated with all-cause mortality during adulthood due to its correlation with various complex diseases.2 Obesity is a complex disorder with strong genetic components.3
Obesity is commonly related to IR and is often linked with various metabolic irregularities. Indians are considered at a greater risk for development of IR and its complications at a lower degree of adiposity.4,5 In India, non-obese individuals develop IR during adolescents putting them at risk of vascular diseases.6 As parallel with the other ethnic groups, for example, Caucasians, phenotypic features of Indians such as body fat, truncal fat, and lean body mass, are significant contributors to IR.7,8 This risk may be because of a complex interplay of several factors, which includes genetics, nutrition, and environmental factors.
Lipoprotein lipase (LPL) gene has emerged as a candidate gene for obesity.9,10 LPL is involved in the regulation of fat storage in adipocytes,11 and also contribute in the thermogenesis in skeletal muscle.12 LPL gene is significantly associated with lipid metabolism.13 An association between polymorphisms in the LPL gene with lipid levels has been observed in the Indian population.14 Another study strongly suggests that the LPL gene HindIII polymorphism significantly associated with myocardial infarction as an independent risk factor in South Indian populations.15 LPL gene HindIII polymorphism is significantly associated with ischemic stroke risk and elevated levels of plasma triglycerides, reduced high-density lipoprotein (HDL) levels, and intracranial large artery atherosclerosis.16 Another study also reported significant associations between LPL gene polymorphisms, and metabolic syndrome.17 The same LPL gene polymorphism is also associated with IR.18
We sought to estimate the importance of sequence variation in the promoter of the LPL gene in association with obesity and obesity-associated phenotypes.
Methods
All subjects included in the study were north Indians by birth and belonged to the northern states of the country (Delhi, Haryana, Jammu and Kashmir, Himachal Pradesh, Uttar Pradesh, Punjab, and Uttarakhand). Individuals not associated with the given states by birth were excluded, and the population was homogeneous with respect to ethnicity (as described in a previous study).19
The local ethics committee approved the study at King George’s Medical University, Lucknow, Uttar Pradesh, India and the study protocol follows the ethical guidelines of the 1975 Declaration of Helsinki. Informed written consent was taken from all subjects willing to participate in the study, and the identity of all participants were kept confidential.
All participants had to follow a careful screening program, which involved individual and family history, physical investigation, determination of anthropometric measurements and biochemical profiles. After screening, a total 642 subjects were selected based on the inclusion/exclusion conditions.
Subjects with body mass index (BMI) of 18.5 to 29.9 kg/m2 (non-obese) and ≥ 30.0 kg/m2 (obese), aged between 20–42 years and born in North India were enrolled in the study. Subjects not fulfilling the above inclusion criteria at the time of interview and/or with congenital disorders, mental disorders, endocrine disorders (e.g., Myxoedema), Cushing’s syndrome, and metabolism disorders (diabetes mellitus), CVD, heart failure, and pregnant women were excluded.
Overall 309 obese subjects (BMI ≥ 30.0) and 333 non-obese subjects (BMI < 30.0) were recruited. The subjects were recruited from Lucknow, Uttar Pradesh, India from the general population via health awareness camps in Lucknow city. All study subjects had their body height, waist circumference (WC), and hip circumference (HC) measured. Height and weight were used to calculate BMI, and WC and HC were used to calculate the waist-to-height ratio (WHR).
Venous blood samples collected following overnight fast were centrifuged within one hour of collection to separate the plasma and serum, frozen in aliquots, and stored at -80 oC until investigated. The insulin level was analyzed by enzyme-linked radio immunosorbent assay (Linco Research, Inc.). The insulin assay has 5.7% inter-assay coefficients of variation.20 The grade of insulin sensitivity/resistance was measured by homeostasis model assessment (HOMA). According to HOMA, IR was considered as described previously,21 using the following equation:
HOMA index (HI) = [fasting insulin (µU/mL) x fasting glucose (mmol/L) / 22.5]
HI < 3.6 indicates non-IR whereas HI ≥ 3.6 indicates IR.
The fasting concentration of glucose was analyzed by the glucose oxidase-peroxidase (GOD-POD) method.22 We used a fat analyzer (Tanita–TBF–310, Japan) to estimate body composition, percentage body fat and fat mass (FM). The analyzer was validated formerly by Radley et al.23
Phenol-chloroform DNA extraction were used to isolate genomic DNA from whole blood. The fragment of polymerase chain reaction (PCR) containing the single nucleotide polymorphisms (SNP) –T93G and –G53C were amplified using the following primers: forward 50-GCTGATCCATCTTGCCAATGTTA-30; and reverse 50-CCGCGGTTTGGCGCTGAGCAAGT-30. SNPs –T93G, –G53C were distinguished by the enzyme HaeIII and BclI.9
Quality control was performed at every step; the ratio of the absorbance at 260 and 280 nm (ratio > 1.75) was used to assess the purity of DNA samples. We used one known genotype sample and one reagent blank for all 25 PCR samples. One-quarter of all samples, including samples of every genotype, were also genotyped by another member of the laboratory.
The independent-samples t-test was utilized to confirm whether the means of groups were considerably dissimilar for two independent groups’ subjects. Allele and genotype distribution was matched between groups using the chi-square test. The Hardy-Weinberg equilibrium was used to verify the independent segregation of alleles, comparing the observed with those expected genotype frequencies (chi-square tests). Different genetic models:
log-additive logistic regression model adjusted for age and sex, were used to see the differences in genotype distributions.
The dissimilarities between the groups (categorized according to genotypes) were evaluated using one-way ANOVA (continuous variables), variables are expressed by the mean and standard deviation (SD). Association of obesity-associated phenotypes with genotype was attained using the additive model. The additive model is used to determine whether the association of genotype with the studied trait is due to genetic or environmental factors. ANOVA was utilized to analyze the association of phenotype associated with obesity among the different genotypes. The statistical power of the study was > 80%. The power of the study (considered by QUANTO version 1.1 program) takes into account the study type (case-control), disease prevalence, and the minor allele frequency in the control population, 0.05 taken as the level of significance. Statistical analysis was performed using SPSS Statistics (SPSS Inc. Released 2007. SPSS for Windows, Version 15.0, Chicago). A p-value < 0.050 was considered statistically significant.
Table 1: Genotype and allele frequency of lipoprotein lipase gene; -93 T<G promoter (rs1800590) polymorphism in study subjects according to body mass index (BMI) and insulin resistance.
|
Genotype |
|
|
|
|
|
TT |
257 (83.2) |
310 (93.1) |
Reference |
Reference |
|
TG |
47 (15.2) |
22 (6.6) |
2.58 (1.51–4.39) |
< 0.001 |
|
GG |
5 (1.6) |
1 (0.3) |
6.03 (0.70–51.95) |
0.102 |
|
TG+GG |
52 (16.8) |
23 (6.9) |
2.73 (1.63–4.58) |
< 0.001 |
|
Allele |
|
|
|
|
|
T |
561 (90. 8) |
642 (96.4) |
Reference |
Reference |
|
G |
57 (9.2) |
24 (3.6) |
2.13 (1.55–3.97) |
< 0.001 |
|
Genotype |
|
|
|
|
|
TT |
208 (88.5) |
359 (88.2) |
Reference |
Reference |
|
TG |
24 (10.2) |
45 (11.1) |
0.92 (0.55–1.56) |
0.757 |
|
GG |
3 (1.3) |
3 (0.7) |
1.73 (0.35–8.63) |
0.506 |
|
TG+GG |
27 (11.5) |
48 (11.8) |
0.97 (0.59–1.60) |
0.908 |
|
Allele |
|
|
|
|
|
T |
440 (93.6) |
763 (93.7) |
Reference |
Reference |
Total number of obese (n = 309) and non-obese subjects (n = 333) (for genotype); total number of chromosomes in obese (n = 618) and non-obese subjects (n = 666) (for alleles); total number of insulin resistant (n = 235) and non-insulin resistant subjects (n = 407)
(for genotype); total number of chromosomes in insulin resistant (n = 470) and non-insulin resistant subjects (n = 814) (for alleles).
*adjusted for age and sex.
**adjusted for age, sex, and BMI.
HOMA: homeostasis model assessment; OR: odds ratio; CI: confidence interval.
Table 2: Physiological parameters and genotypic classes for lipoprotein lipase gene; -93 T<G promoter (rs1800590) polymorphism in obese and non-obese subjects.
|
BMI |
33.2 ± 1.3 |
34.4 ± 2.0 |
38.0 ± 1.7 |
23.0 ± 3.4 |
27.0 ± 2.9 |
|
p-value |
|
0.001 |
|
0.001 |
|
|
Fasting glucose, mg/dL |
109.7 ± 19.1 |
107.7 ± 15.6 |
119.2 ± 17.6 |
109.0 ± 15.8 |
111.5 ± 17.5 |
|
p-value |
|
0.406 |
|
0.476 |
|
|
Fasting insulin, mU/mL |
14.5 ± 8.7 |
16.1 ± 11.5 |
18.7 ± 11.9 |
10.2 ± 6.0 |
11.1 ± 5.6 |
|
p-value |
|
0.360 |
|
0.490 |
|
|
HOMA index |
4.0 ± 2.7 |
4.4 ± 3.5 |
5.4 ± 3.0 |
2.8 ± 1.8 |
3.0 ± 1.5 |
|
p-value |
|
0.406 |
|
0.534 |
|
|
Percentage body fat |
36.4 ± 5.8 |
40.9 ± 6.1 |
44.7 ± 6.8 |
24.6 ± 5.5 |
29.0 ± 6.1 |
|
p-value |
|
< 0.001 |
|
0.006 |
|
|
FM, kg |
29.7 ± 7.6 |
34.1 ± 9.8 |
43.1 ± 11.6 |
17.9 ± 9.6 |
22.6 ± 8.0 |
Data presented as mean±SD.
HOMA index: homeostasis model assessment index; FM: fat mass; BMI: body mass index.
*TT vs. TG+GG.
Table 3: Physiological parameters and genotypic classes for lipoprotein lipase gene; -93 T<G promoter (rs1800590) polymorphism in insulin resistant and non-insulin resistant subjects.
|
BMI |
30.4 ± 4.5 |
33.3 ± 5.7 |
39.6 ± 7.0 |
27.7 ± 5.4 |
30.3 ± 5.7 |
33.5 ± 6.6 |
|
p-value |
|
< 0.001 |
|
|
0.003 |
|
|
Fasting glucose, mg/dL |
119.0 ± 18.8 |
117.1 ± 18.8 |
123.0 ± 18.8 |
103.8 ± 13.7 |
104.8 ± 14.2 |
109.4 ± 7.1 |
|
p-value |
|
0.829 |
|
|
0.701 |
|
|
Fasting insulin, mU/mL |
20.0 ± 6.6 |
24.7 ± 7.9 |
27.0 ± 8.8 |
5.7 ± 3.7 |
8.6 ± 3.4 |
9.1 ± 2.3 |
|
p-value |
|
< 0.001 |
|
|
0.004 |
|
|
HOMA index |
4.8 ± 2.1 |
6.5 ± 0.9 |
8.7 ± 2.4 |
1.8 ± 0.1 |
2.9 ± 0.8 |
3.1 ± 0.6 |
|
p-value |
|
< 0.001 |
|
|
0.004 |
|
|
Percentage body fat |
34.0 ± 6.5 |
40.6 ± 9.5 |
48.2 ± 4.9 |
30.5 ± 7.4 |
33.3 ± 8.4 |
38.1 ± 5.2 |
|
p-value |
|
< 0.001 |
|
|
0.018 |
|
|
FM, kg |
27.9 ± 8.7 |
34.5 ± 12.5 |
46.0 ± 9.3 |
22.8 ± 8.7 |
26.8 ± 10.7 |
34.5 ± 14.2 |
Data presented as mean±SD.
HOMA index: homeostasis model assessment index; FM: fat mass; BMI: body mass index.
Results
Obese subjects had considerably upper WHR and WC. Fasting insulin (p < 0.001), HI (p < 0.001), percentage body fat (p < 0.001), and FM (p < 0.001) were also significantly greater among obese subjects compared to non-obese subjects. Other clinical and biochemical characteristics of study participant are presented in the previous article of our group.24
In non-obese subjects the frequency of -93G and -53C variant alleles were 3.6 and 4.8%, respectively. The polymorphisms existed in no linkage disequilibrium. The pooled genotype class TG and GG (TG+GG) and allele frequencies of the sequence variation in the promoter area at -93 bp were significantly different among the non-obese and obese subjects [Table 1]. Stratification of the study subjects based on IR revealed that the frequency of the pooled genotype and allele of -93 T<G variant was not different among IR subjects (27/235, 11.5%) compared with non-IR subjects (48/407, 11.8%).
We observed statistically significant differences in the dispersal of genotypes and alleles among obese and non-obese subjects. Analysis of regression discovered the odds ratio (OR) for the studied trait, for the subjects having the pooled genotype (TG+GG) was 2.73 (95% confidence intervals (CI): 1.63–4.58, p < 0.001) adjusted for age and sex.
The relationship of -93 T<G SNPs with obesity were additionally sustained by its association with obesity-related traits [Table 2 and 3]. The non-obese subjects with pooled genotype (TG+GG) of -93 T<G SNP had greater BMI (TT, 23.0±3.4 kg/m2 vs. TG+GG, 27.0±2.9 kg/m2, p = 0.001), percentage body fat (TT, 24.6±5.5 vs. TG+GG, 29.0±6.1, p = 0.006), and FM (TT, 17.9±9.6 vs. TG+GG, 22.6±8.0, p = 0.007) values compared to individuals with the TT genotype.
Correspondingly, in obese subjects, genotypes of -93 T<G SNP showed different BMI, percentage body fat, and FM in obese and non-obese subjects.
The allele and genotype frequencies of -53 G<C promoter polymorphism of the LPL gene were statistically significant between non-IR and IR subjects and non-significant in non-obese and obese subjects [Table 4]. Analysis of regression showed the OR (adjusted for age, sex, and BMI) for IR subjects for pooled genotype (GC+CC) genotype was 10.76 (95% CI: 5.16–11.45, p < 0.001).
The association of -53 G<C variant with IR was further supported by its association with IR-related traits [Table 5 and 6]. The non-IR subjects with pooled genotype (GC+CC) of -53 G<C SNP had higher insulin (GG, 4.2±1.6 vs. GC+CC, 7.1±2.7, p = 0.013), and HI (GG, 1.4±0.5 vs. GC+CC, 2.3±0.7, p = 0.027) values matched by subjects with TT genotype [Table 6].
Table 4: Genotype and allele frequency of the lipoprotein lipase gene; -53 G<C promoter polymorphism in study subjects according to body mass index (BMI) and insulin resistance.
|
Genotype |
|
|
|
|
|
GG |
283 (91.6) |
304 (91.3) |
Reference |
Reference |
|
GC |
14 (4.5) |
26 (7.8) |
0.57 (0.29–1.12) |
0.105 |
|
CC |
12 (3.9) |
3 (0.9) |
2.93 (0.92–9.32) |
0.068 |
|
GC + CC |
26 (8.4) |
29 (8.7) |
0.89 (0.51–1.55) |
0.678 |
|
Allele |
|
|
|
|
|
G |
580 (93.9) |
634 (95.2) |
Reference |
Reference |
|
C |
38 (6.1) |
32 (4.8) |
0.78 (0.58–1.43) |
0.823 |
|
Genotype |
|
|
|
|
|
GG |
190 (80.9) |
397 (97.5) |
Reference |
Reference |
|
GC |
37 (15.7) |
3 (0.7) |
40.01 (9.55–167.60) |
< 0.001 |
|
CC |
8 (3.4) |
7 (1.7) |
2.41 (0.860–6.74) |
0.094 |
|
GC + CC |
45 (19.1) |
10 (2.4) |
10.76 (5.16–11.45) |
< 0.001 |
|
Allele |
|
|
|
|
|
G |
417 (88.7) |
797 (97.9) |
Reference |
Reference |
Total number of obese (n = 309) and non-obese subjects (n = 333) (for genotype); total number of chromosomes in obese (618) and non-obese subjects (n = 666) (for alleles); total number of insulin resistant (n = 235) and non-insulin resistant subjects (n = 407)
(for genotype); total number of chromosomes in insulin resistant (n = 470) and non-insulin resistant subjects (n = 814) (for alleles).
*adjusted for age and sex.
**adjusted for age, sex, and BMI.
OR: odds ratio; CI: confidence interval.
Table 5: Physiological parameters and genotypic classes for lipoprotein lipase gene; -53 G<C promoter polymorphism in obese and non-obese subjects.
|
BMI |
33.2 ± 3.3 |
34.7 ± 4.4 |
36.7 ± 5.6 |
22.8 ± 3.3 |
23.8 ± 2.6 |
24.8 ± 3.0 |
26.7 ± 2.9 |
|
p-value |
|
0.002 |
|
|
0.017 |
|
0.004 |
|
Fasting glucose, mg/dL |
109.2 ± 18.5 |
116.9 ± 20.2 |
111.4 ± 16.9 |
112.4 ± 15.6 |
112.1 ± 15.5 |
116.4 ± 34.3 |
115.4 ± 17.7 |
|
p-value |
|
0.297 |
|
|
0.078 |
|
0.083 |
|
Fasting insulin, mU/mL |
13.7 ± 8.2 |
18.7 ± 11.3 |
33.9 ± 1.5 |
8.2 ± 4.8 |
9.3 ± 5.0 |
20.8 ± 6.6 |
19.5 ± 7.4 |
|
p-value |
|
< 0.001 |
|
|
< 0.001 |
|
< 0.001 |
|
HOMA index |
3.8 ± 2.6 |
5.1 ± 3.1 |
9.8 ± 1.7 |
2.5 ± 1.5 |
2.8 ± 2.4 |
5.9 ± 2.0 |
5.6 ± 2.2 |
|
p-value |
|
< 0.001 |
|
|
< 0.001 |
|
< 0.001 |
|
Percentage body fat |
36.9 ± 6.1 |
40.2 ± 5.1 |
41.3 ± 5.8 |
26.6 ± 6.1 |
29.8 ± 5.9 |
31.7 ± 4.7 |
30.9 ± 5.7 |
|
p-value |
|
0.008 |
|
|
0.014 |
|
0.022 |
|
FM, kg |
30.2 ± 8.1 |
34.3 ± 9.7 |
34.2 ± 10.0 |
20.3 ± 8.2 |
20.3 ± 7.2 |
20.3 ± 4.7 |
22.9 ± 7.0 |
Data presented as mean±SD.
HOMA index: homeostasis model assessment index; FM: fat mass; BMI: body mass index.
Table 6: Physiological parameters and genotypic classes for lipoprotein lipase gene; -53 G<C promoter polymorphism in insulin resistant and non-insulin resistant subjects.
|
BMI |
29.7 ± 5.4 |
30.8 ± 4.5 |
35.4 ± 6.6 |
27.4 ± 2.0 |
28.0 ± 5.4 |
34.0 ± 6.8 |
32.0 ± 6.4 |
|
p-value |
|
0.009 |
|
|
0.016 |
|
0.022 |
|
Fasting glucose, mg/dL |
119.3 ± 18.6 |
116.1 ± 16.8 |
119.8 ± 27.8 |
103.7 ± 13.7 |
120.2 ± 23.8 |
109.0 ± 7.5 |
112.4 ± 13.9 |
|
p-value |
|
0.624 |
|
|
0.071 |
|
0.048 |
|
Fasting insulin, mU/mL |
19.4 ± 6.4 |
24.2 ± 9.9 |
27.0 ± 6.1 |
4.2 ± 1.6 |
7.7 ± 3.3 |
8.9 ± 2.7 |
7.1 ± 2.7 |
|
p-value |
|
< 0.001 |
|
|
0.005 |
|
0.013 |
|
HOMA index |
5.6 ± 2.0 |
6.8 ± 2.4 |
7.7 ± 2.1 |
1.4 ± 0.5 |
1.9 ± 0.8 |
2.8 ± 0.7 |
2.3 ± 0.7 |
|
p-value |
|
<0.001 |
|
|
0.006 |
|
0.027 |
|
Percentage body fat |
34.8 ± 7.1 |
34.2 ± 8.0 |
39.8 ± 6.7 |
30.8 ± 7.6 |
29.3 ± 8.7 |
36.6 ± 5.8 |
34.4 ± 7.2 |
|
p-value |
|
0.137 |
|
|
0.125 |
|
0.135 |
|
FM, kg |
28.9 ± 9.5 |
27.7 ± 9.6 |
33.3 ± 10.8 |
23.3 ± 9.0 |
19.1 ± 8.3 |
29.4 ± 10.9 |
26.3 ± 10.9 |
Data presented as mean±SD.
HOMA index: homeostasis model assessment index; FM: fat mass; BMI: body mass index.
*GG vs. GC+CC.
Discussion
The -93 T<G SNP showed a significant association with higher risk of obesity. The -53 G<C SNP showed an emerging risk of IR in the North Indian population. Previously, we reported a significant association between the FTO gene polymorphism with IR.24 To the best of our knowledge, this is the first report to consider the association of these polymorphisms with obesity and associated phenotypes like IR in the North Indian population.
Subjects with the pooled genotype (TG+GG) of -93 T<G SNP were at 2.73-fold increased risk of obesity compared to subjects with the TT genotype. Additionally, subjects with pooled genotype (TG+GG) had considerably increase BMI, percentage body fat, and FM values compared to non-obese subjects with the TT genotype.
The TG replacement at nucleotide -93 lies two bases 5’ to a preserved reversed GA box in the LPL gene.25 This essential motif binds the transcription factors and is important for LPL promoter action. The simple recognition unit of the specificity protein (Sp) family transcription factors, known as a GC box. Furthermore, GA and GT boxes can similarly bind Sp proteins in the LPL gene’s promoters. The nucleotides flanking this preserved component may stimulate the binding affinity of Sp1 and Sp3.25
Previous functional experiments using the rat smooth muscle cell line revealed the -93G promoter had increased activity in vitro than the -93T promoter.26 In the human adrenal cell line, NCIH295, similar observations were obtained using the luciferase assay with the G allele.26 The association of -93T<G variant also observed with other measures of obesity-associated phenotypes, especially percentage body fat and FM, suggests it could be a significant contributor to obesity and obesity-associated comorbidities. A sex-specific association of the LPL gene polymorphisms with body fat has been suggested.27 Even though the -93G promoter polymorphism is not associated with IR this promoter variant showed association with different measures of IR phenotypes especially fasting insulin, HI, percentage body fat, and FM in IR and non-IR subjects with almost the same intensity.
In different populations, -53 G<C promoter polymorphism was established as a rare variant.9,28 However, these studies showed a significant association with less risk of increasing obesity and other vascular diseases. In our study, -53 G<C promoter polymorphism showed a significant association with IR but no association with obesity. Significant association of clinical and biochemical parameters of IR (like fasting insulin and HI) were observed with the genotypes of this promoter SNP in IR and non-IR subjects.
In previous studies, LPL gene polymorphisms were shown to be related to different features of dyslipidemia, CAD, and MI but these studies are mostly based on South Indian populations.14–16,29
These studies explain the significance of the LPL gene association with vascular disease including obesity and associated phenotypes in the Indian population. Thus, the findings of present study support that the LPL gene polymorphism is associated with obesity and obesity-associated phenotypes especially IR which may stimulate the development of other vascular diseases in North Indian populations [Figure 1].
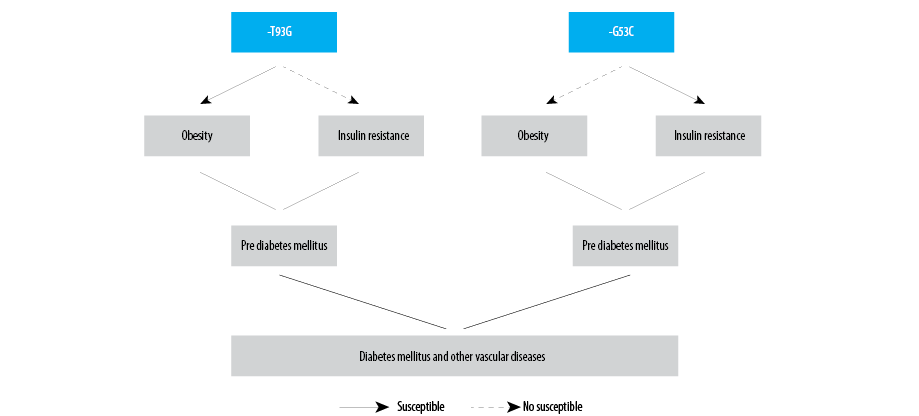
Figure 1: Schematic representation of association of the studied polymorphisms of lipoprotein lipase gene.
Conclusions
Genetic variants in the LPL gene might play a significant role in predisposing obesity and obesity-associated phenotypes risk, especially IR, in the North Indian population, signifying them as important genetic determinants of obesity and obesity-associated phenotypes.
Disclosure
The authors declared no conflicts of interest. The study was funded by the Indian Council of Medical Research, New Delhi, India [SAN No - 45/14/2008-HUM-BMS].
Acknowledgements
The authors acknowledge all the participants of the study.
references
- 1. Finucane MM, Stevens GA, Cowan MJ, Danaei G, Lin JK, Paciorek CJ, et al; Global Burden of Metabolic Risk Factors of Chronic Diseases Collaborating Group (Body Mass Index). National, regional, and global trends in body-mass index since 1980: systematic analysis of health examination surveys and epidemiological studies with 960 country-years and 9·1 million participants. Lancet 2011 Feb;377(9765):557-567.
- 2. Flegal KM, Kit BK, Orpana H, Graubard BI. Association of all-cause mortality with overweight and obesity using standard body mass index categories: a systematic review and meta-analysis. JAMA 2013 Jan;309(1):71-82.
- 3. Dosaev T, Prakash J, Livshits G. Contribution of body composition components and soft-tissue biochemical factors to genetic variation of body mass index (BMI) in an ethnically homogeneous population. Am J Hum Biol 2014 Nov-Dec;26(6):760-767.
- 4. Vikram NK, Pandey RM, Misra A, Sharma R, Devi JR, Khanna N. Non-obese (body mass index < 25 kg/m2) Asian Indians with normal waist circumference have high cardiovascular risk. Nutrition 2003 Jun;19(6):503-509.
- 5. Chandalia M, Lin P, Seenivasan T, Livingston EH, Snell PG, Grundy SM, et al. Insulin resistance and body fat distribution in South Asian men compared to Caucasian men. PLoS One 2007 Aug;2(8):e812.
- 6. Misra A, Madhavan M, Vikram NK, Pandey RM, Dhingra V, Luthra K. Simple anthropometric measures identify fasting hyperinsulinemia and clustering of cardiovascular risk factors in Asian Indian adolescents. Metabolism 2006 Dec;55(12):1569-1573.
- 7. Misra A, Khurana L. Obesity-related non-communicable diseases: South Asians vs White Caucasians. Int J Obes (Lond) 2011 Feb;35(2):167-187.
- 8. Misra A, Alappan NK, Vikram NK, Goel K, Gupta N, Mittal K, et al. Effect of supervised progressive resistance-exercise training protocol on insulin sensitivity, glycemia, lipids, and body composition in Asian Indians with type 2 diabetes. Diabetes Care 2008 Jul;31(7):1282-1287.
- 9. Radha V, Vimaleswaran KS, Ayyappa KA, Mohan V. Association of lipoprotein lipase gene polymorphisms with obesity and type 2 diabetes in an Asian Indian population. Int J Obes (Lond) 2007 Jun;31(6):913-918.
- 10. Kiens B, Roepstorff C, Glatz JF, Bonen A, Schjerling P, Knudsen J, et al. Lipid-binding proteins and lipoprotein lipase activity in human skeletal muscle: influence of physical activity and gender. J Appl Physiol (1985) 2004 Oct;97(4):1209-1218.
- 11. Gonzales AM, Orlando RA. Role of adipocyte-derived lipoprotein lipase in adipocyte hypertrophy. Nutr Metab (Lond) 2007 Oct;4:22.
- 12. Kusunoki M, Tsutsumi K, Iwata K, Yin W, Nakamura T, Ogawa H, et al. NO-1886 (ibrolipim), a lipoprotein lipase activator, increases the expression of uncoupling protein 3 in skeletal muscle and suppresses fat accumulation in high-fat diet-induced obesity in rats. Metabolism 2005 Dec;54(12):1587-1592.
- 13. Jayashree S, Arindam M, Vijay KV. Genetic epidemiology of coronary artery disease: an Asian Indian perspective. J Genet 2015 Sep;94(3):539-549.
- 14. Radha V, Mohan V, Vidya R, Ashok AK, Deepa R, Mathias RA. Association of lipoprotein lipase Hind III and Ser 447 Ter polymorphisms with dyslipidemia in Asian Indians. Am J Cardiol 2006 May;97(9):1337-1342.
- 15. Tanguturi PR, Pullareddy B, Rama Krishna BS, Murthy DK. Lipoprotein lipase gene HindIII polymorphism and risk of myocardial infarction in South Indian population. Indian Heart J 2013 Dec;65(6):653-657.
- 16. Munshi A, Babu MS, Kaul S, Rajeshwar K, Balakrishna N, Jyothy A. Association of LPL gene variant and LDL, HDL, VLDL cholesterol and triglyceride levels with ischemic stroke and its subtypes. J Neurol Sci 2012 Jul;318(1-2):51-54.
- 17. Ranjith N, Pegoraro RJ, Rom L. Lipid profiles and associated gene polymorphisms in young Asian Indian patients with acute myocardial infarction and the metabolic syndrome. Metab Syndr Relat Disord 2009 Dec;7(6):571-578.
- 18. Li DD, Su DY, Xue L, Gao W, Pang WY. Relationship between a lipoprotein lipase gene polymorphism in placental tissue and insulin resistance in patients with gestational diabetes mellitus. Genet Mol Res 2015 Jul;14(3):7751-7758.
- 19. Prakash J, Srivastava N, Awasthi S, Agarwal C, Natu S, Rajpal N, et al. Association of PPAR-g gene polymorphisms with obesity and obesity-associated phenotypes in North Indian population. Am J Hum Biol 2012 Jul-Aug;24(4):454-459.
- 20. Prakash J, Mittal B, Awasthi S, Agarwal CG, Srivastava N. K121Q ENPP1/PC-1 gene polymorphism is associated with insulin resistance in a North Indian population. J Genet 2013 Dec;92(3):571-576.
- 21. Matthews DR, Hosker JP, Rudenski AS, Naylor BA, Treacher DF, Turner RC. Homeostasis model assessment: insulin resistance and beta-cell function from fasting plasma glucose and insulin concentrations in man. Diabetologia 1985 Jul;28(7):412-419.
- 22. Young DS, Pestaner LC, Gibberman V. Effects of drugs on clinical laboratory tests. Clin Chem 1975 Apr;21(5):1D-432D.
- 23. Radley D, Cooke CB, Fuller NJ, Oldroyd B, Truscott JG, Coward WA, et al. Validity of foot-to-foot bio-electrical impedance analysis body composition estimates in overweight and obese children. Int J Body Compos Res 2009 Feb;7(1):15-20.
- 24. Prakash J, Mittal B, Srivastava A, Awasthi S, Srivastava N. Association of FTO rs9939609 SNP with Obesity and Obesity- Associated Phenotypes in a North Indian Population. Oman Med J 2016 Mar;31(2):99-106.
- 25. Yang WS, Nevin DN, Iwasaki L, Peng R, Brown BG, Brunzell JD, et al. Regulatory mutations in the human lipoprotein lipase gene in patients with familial combined hyperlipidemia and coronary artery disease. J Lipid Res 1996 Dec;37(12):2627-2637.
- 27. Hall S, Chu G, Miller G, Cruickshank K, Cooper JA, Humphries SE, et al. A common mutation in the lipoprotein lipase gene promoter, -93T/G, is associated with lower plasma triglyceride levels and increased promoter activity in vitro. Arterioscler Thromb Vasc Biol 1997 Oct;17(10):1969-1976.
- 28. Garenc C, Pérusse L, Bergeron J, Gagnon J, Chagnon YC, Borecki IB, et al. Evidence of LPL gene-exercise interaction for body fat and LPL activity: the HERITAGE Family Study. J Appl Physiol (1985) 2001 Sep;91(3):1334-1340.
- 29. Ehrenborg E, Clee SM, Pimstone SN, Reymer PW, Benlian P, Hoogendijk CF, et al. Ethnic variation and in vivo effects of the -93t–>g promoter variant in the lipoprotein lipase gene. Arterioscler Thromb Vasc Biol 1997 Nov;17(11):2672-2678.
- 30. AshokKumar M, Veera Subhashini NG, Kanthimathi S, SaiBabu R, Ramesh A, Cherian KM, et al. Associations for lipoprotein lipase and peroxisome proliferator-activated receptor-gamma gene and coronary artery disease in an Indian population. Arch Med Res 2010;41(1):19-25.e1.