The physical and financial implications of road accidents have serious economic, cultural, and social effects. Nearly three-quarters of road deaths occur in developing countries, although road deaths are common in developed countries.1 The World Health Organization (WHO) reported that in 2006 traffic crashes resulted in 1.2 million deaths, which increased to 1.3 million deaths in 2009.2
Despite having only 52% of the registered vehicles in the world, 80% percent of all road traffic fatalities happen in third-world countries.3
According to the WHO annual report, about 20–50 million people are physically injured or disabled every year because of road injuries. The highest rate of deaths is among people aged 15–49 years old; the majority of these are men. Therefore, in addition to workforce loss and financial damages, there is the added costs of children being orphaned and families losing the main earner. Based on 2003 WHO report, the economic costs of road injuries in low and high-income countries were about 1% and 2% of gross domestic product (GDP), respectively, with the global cost about US$ 518 billion per year. However, the research funds invested in the prevention of road-accident-related deaths is very little compared to that spent to prevent diseases such as AIDS and malaria. 2
An epidemiological study by Odero et al. in Kenya, reported that the death rate from road injuries grew 7% from 2004 to 2007. A 2013 WHO report showed that the number of deaths from road injuries was 1.24 million in 2010.4 According to the report, the number of road injuries decreased in 88 countries between 2007 and 2010. Among these 88 countries, 42 were high-income, 41 were middle-income, and five were low-income. The number of deaths from road injuries increased in 87 countries.5 Africa had the highest rate of road injury deaths. Furthermore, the death rate in high-income European countries was one-third of the rate of low-income ones. The same pattern was found in Western Pacific and Southeast Asian countries.5
A study by the Australian Health Organization showed that from 2001 to 2009, concurrent with the reduction in death rate from road injuries, the related disability-adjusted life-years (DALYs) increase.5 A study from Italy investigated the trend in road injuries-related death from 1996 to 2005 where the number of road accidents was considered a function of the number of cars. They showed that along with increasing the number of cars, road injuries, and as a consequence serious physical injuries, increased until 2003. However, from 2003 to 2005, despite the increase in the number of cars, the road accident rate declined demonstrating the effectiveness of the implemented interventions.6
In a review of the distribution of fatalities from road crashes based on different parts of the world, Putignano et al. showed that the road injury death rate in high-income countries was one-third the rate in low-income ones.6 In 2002, road injuries ranked ninth among the leading causes of death and fifth in 2004. The WHO proclaimed 2011–2020 as a decade of action for road safety, owing to the importance of road and related injuries.7
Our study looked for changes in the trend of road accident-related deaths in Asian and North African countries between 1990 and 2010. We analyzed the road-related death data using the growth curve model. We used growth mixed modeling (GMM) to classify countries with similar changes in the death rate from 1990 to 2010.
Methods
The current study was carried out using the Global Burden of Disease (GBD) database on road injury death. The GBD epidemiological study has been the largest study on the causes of death and physical injuries to date. The study includes millions of observations on risk factors, causes of mortality, and disease incidences in five-year periods. Furthermore, about 400 scientists worldwide have participated in the study and the results obtained up to 2010 were published in 2014.On the database, Asian and North African countries lie in the same cluster and have been divided into six regions. Table 1 addresses the categories and countries. The data used in the current study was of traffic deaths in Asian and North African countries for the years 1990, 1995, 2000, 2005, and 2010.
Table 1: Institute for Health Metrics and Evaluation (IHME) regions of Asia and North Africa.
|
Region 1 |
South Asia
Afghanistan, Bangladesh, Bhutan, India, Nepal, Pakistan. |
|
Region 2 |
Central Asia
Armenia, Azerbaijan, Georgia, Kazakhstan, Kyrgyzstan, Mongolia, Tajikistan, Turkmenistan, Uzbekistan. |
|
Region 3 |
North Africa/Middle East
Algeria, Bahrain, Egypt, Iran, Iraq, Jordan, Kuwait, Lebanon, Libya, Morocco, Oman, Palestine, Qatar, Saudi Arabia, Syria, Tunisia, Turkey, UAE, Yemen. |
|
Region 4 |
East Asia
China, North Korea, Taiwan. |
|
Region 5 |
Southeast Asia
Burma, Cambodia, Indonesia, Laos, Malaysia, Maldives, Philippines, Sri Lanka, Thailand, Timor-Leste, Vietnam. |
We used latent growth curve modeling (LGM) as a method of data analysis. LGM is a simple examining method used to assess interindividual (between individuals) and intraindividual (within individual) changes over time.7 LGM is appealing not only because of ability to model change but because it also allows investigation into the antecedents and consequents of change.8
In this variation model, the response variable is estimated by intercept and trajectory slope. In essence, in terms of formulation, LGM is a special case of structural equation modeling (SEM). SEM is a general method to assess relationship patterns among a set of observed and latent variables. Where intercept and slope are considered latent variables.9
When using LGM, we assume that a single latent trajectory is sufficient to characterize the pattern of change in a population while allowing for random error in that trajectory. In other words, we assume homogeneity of all individuals’ trajectories. But, this hypothesis is unrealistic (i.e., separate growth trajectories may be estimated simultaneously within each of several known groups, with or without cross-group constraints on key parameters). However, it need not be the case that a classification variable is observed; it is quite possible that latent (unobserved) classes could give rise to heterogeneous trajectories. If more than one such class exists, but only one trajectory is specified, significant bias is likely to be introduced, and the resulting trajectory may misrepresent all trajectory classes. Disregarding heterogeneity in individuals’ trajectories can lead us into false analysis. The GMM classifies individuals into groups with different change patterns, without considering the hypothesis.
In GMM, the heterogeneity among individuals in change patterns is estimated through combining fixed and random effect(s) models. The mixed model classifies individuals into similar groups and the random effects model estimates the trajectory or pattern of changes. GMM has increasingly gained its popularity in longitudinal studies in various areas of behavioral and health sciences due to its usefulness in classifying individuals into groups with distinct growth trajectories.10
In this study, the fatality rate was obtained using the LGM method based on the Institute for Health Metrics and Evaluation (IHME) classification. In this method, the intercept mean is estimated, and the change rate over time is shown as a slope. Since there are six areas classified by IHME based on geographical and economic criteria, in the second step, regardless of IHME classification, 52 Asian and North African countries were analyzed and reclassified based on the change rate using the GMM method. This means that in each group of countries the fatality rate caused by road injuries begins with a specific mean and trajectory over time.
Results
Table 2 shows the road injuries fatality rate per 100 000 people in six regions classified by the IHME from 1990 to 2010. As presented in Table 2, the death rates for women are lower than those for men in all regions. For instance, in 2010 the mortality rate from road injuries in East Asian countries was 9.5 per 100 000 people for women, but 28.6 per 100 000 for men.
Table 2: Institute for Health Metrics and Evaluation reports for road injury fatality rate per 100 000 in Asia and North Africa by gender from 1990 to 2010.
|
Central Asia |
Female |
8.7
(6.11, 9.47) |
7.0
(6.22, 9.69) |
5.8
(5.01, 7.7) |
7.2
(6.32, 8.93) |
7.5
(5.89, 10.31) |
|
Male |
34.8
(23.63, 40.00) |
27.9
(22.80, 40.00) |
23.0
(19.20, 34.94) |
27.4
(23.07, 38.00) |
28.3
(21.78, 41.39) |
|
East Asia |
Female |
8.0
(4.81, 10.50) |
9.5
(6.37, 10.50) |
10.0
(7.50, 11.49) |
9.2
(8.11, 13.84) |
9.5
(7.94, 15.79) |
|
Male |
20.7
(12.00, 33.96) |
24.5
(16.46, 32.00) |
27.1
(20.07, 34.94) |
27.2
(21.10, 38.67) |
28.6
(18.86, 46.47) |
|
High-income Asia Pacific |
Female |
7.3
(6.00, 8.58) |
7.4
(4.64, 8.19) |
5.8
(4.30, 6.50) |
4.3
(3.90, 5.80) |
3.6
(3.24, 5.14) |
|
Male |
22.8
(17.28, 27.87) |
22.1
(16.00, 25.20) |
16.3
(12.29, 20.56) |
12.6
(10.11, 17.37) |
10.5
(8.59, 15.21) |
|
North Africa and Middle East |
Female |
10.1
(9.00, 13.50) |
10.1
(8.57, 12.56) |
10.1
(8.30, 12.12) |
9.5
(7.59, 11.46) |
8.7
(7.15, 10.80) |
|
Male |
32.5
(26.00, 46.52) |
32.4
(25.36, 44.00) |
32.9
(25.70, 42.30) |
32.5
(24.90, 40.97) |
30.7
(22.66, 39.22) |
|
South Asia |
Female |
8.4
(5.86, 9.52) |
9.4
(6.24, 10.62) |
9.2
(7.70, 11.55) |
8.9
(6.92, 12.82) |
9.8
(6.26, 16.64) |
|
Male |
26.7
(19.50, 34.07) |
29.8
(20.83, 36.85) |
29.7
(21.37, 39.40) |
29.9
(20.77, 43.95) |
33.9
(21.04, 58.23) |
|
Female |
10.9
(7.83, 16.63) |
12.8
(9.51, 17.50) |
13.0
(10.24, 16.76) |
11.8
(10.09, 14.21) |
11.6
(10.07, 14.49) |
*Data given as number per 100 000 and (upper and lower number of deaths).
Furthermore, the road injury death trend for men has more variations. For example, the number of deaths for men in South Asian countries increased from 26.7 per 100 000 in 1990 to 33.9 per 100 000 in 2010. In high-income South Asian countries there was a decreasing trend; from 22.8 to 10.5 per 100 000 from 1990 and 2010, respectively.
Table 3 shows the estimated intercept and slope according to gender for each of the six regions (all intercepts and slopes in this studies are in the scale of death per 100 000 people). High-income Asia Pacific countries had the highest decreasing trend (-4.22). All countries of this region (South Korea, Japan, Brunei, and Singapore) showed a decreased rate over time, followed by East Asian countries (-2.35). However, the traffic death rate in China rose from 20.7 to 28.6 deaths from 1990 to 2010, respectively. In the other four regions, the amount was less than one despite the negative slope. It seems that classifying countries (except high-income countries, which had a decreasing trend) based on this zoning method does not provide precise information on the traffic death rate over time because each region includes countries with different increasing and decreasing trends.
Table 3: Simple growth modeling results for road injury fatality rates in IHME regions by gender.
|
Central Asia |
Male |
25.16 |
0.08 |
|
Female |
9.09 |
-0.32 |
|
South Asia |
Male |
42.57 |
-0.56 |
|
Female |
8.80 |
-0.79 |
|
North Africa and Middle East |
Male |
26.95 |
0.06 |
|
Female |
9.09 |
-0.34 |
|
East Asia |
Male |
31.35 |
-2.35 |
|
Female |
11.80 |
-0.83 |
|
Southeast Asia |
Male |
27.80 |
-0.03 |
|
Female |
11.02 |
-0.19 |
|
Male |
34.53 |
-4.22 |
IHME: Institute for Health Metrics and Evaluation.
Regardless of IHME classification, all 52 countries were reclassified using the GMM method. In this method the Lo-Mendell-Rubin (LMR) likelihood ratio test was used to determine the optimal number of classes. This test compares a K0-class normal mixture distribution model against an alternative K−1-class normal mixture distribution model (where K−1 < K0). A p-value < 0.050 (5%) indicates that the K0-class model provides significantly better fit to the observed data than the K−1-class model.11 Due to the small sample size for classification, a 0.1 level of significance was selected to test the differences.
In females, two optimal classes were estimated. In the first class, the mean of the intercept and slope were 21.19 and -2.11, respectively. This group had a higher starting point, but with a nearly steeper negative slope in the traffic death rate. South Korea, Bahrain, Oman, Taiwan, and the Maldives were in this group. In the second class, the traffic death rate started with an estimated intercept mean of 8.80, but changed with lower positive slope of 0.50 over time. The remaining countries were also in this class. Figure 1(a) illustrates the changes of these classes over time.
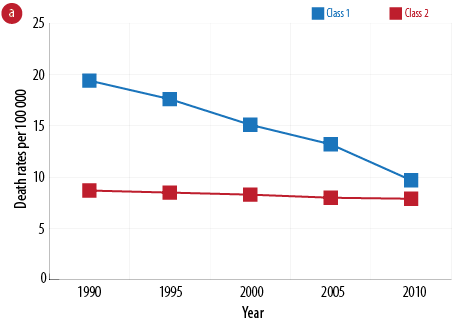
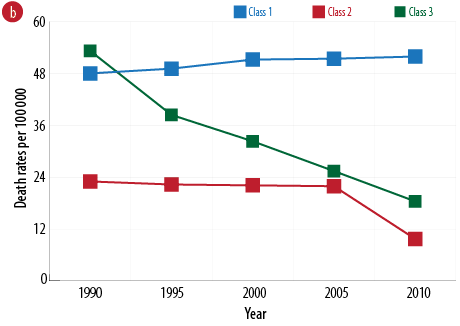
Figure 1: Estimated trends fatality rate of road injury in different classes from 1990 to 2010 for
(a) females and (b) males.
There are three optimal classes for males [Table 4]. In the first class, the mean of the intercept estimated as 48.00 deaths per 100 000 and the mean of the slope is 0.71. Therefore, there is a large death rate with a decreasing change pattern with low slope. Afghanistan, Mongolia, Indonesia, Thailand, Iran, Oman, Saudi Arabia, and Tunisia are in this group. The second class only contains South Korea, with the mean of the intercept estimated as 52.00 deaths per 100 000 and changed with a high decreasing slope of -6.97 over time. This means that the number of traffic deaths declined by an average of 7.00 deaths per 100 000 over each five-year period. The mean of the intercept for the third class was 22.00 deaths per 100 000, which changed with a low decreasing slope of -0.30. Most countries are in this group. Figure 1(b) illustrates the changes of these classes.
Table 4: Countries in each class by gender.
|
Both |
1 |
Afghanistan, Indonesia, Thailand, Iran, Oman, Saudi Arabia, UAE |
|
2 |
Bangladesh, Singapore, Syria |
|
3 |
Taiwan, South Korea |
|
4 |
The other countries in North Africa and Asia |
|
Male |
1 |
Afghanistan, Mongolia, Indonesia, Thailand, Iran, Oman, Saudi Arabia, Tunisia |
|
2 |
South Korea |
|
3 |
The other countries in North Africa and Asia |
|
1 |
Afghanistan, Nepal, India, Turkmenistan, Japan, Cambodia, Bahrain, Iran, Qatar, UAE |
The traffic death trend was clustered separately into five age groups based on the IHME Research Center classification. Figure 2 shows the distribution of traffic deaths per 100 000 individuals in different age groups in all countries. The highest rate of death was observed in the over 70 age group.
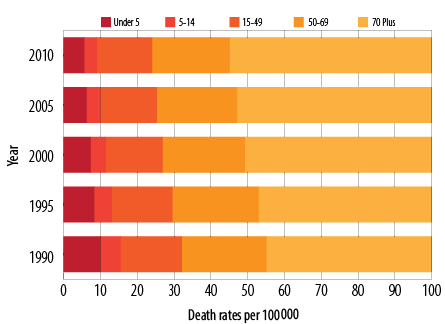
Figure 2: Frequency of fatality rate of road injury in different classes from 1990 to 2010 for each age group (deaths per 100 000).
In the under fives age group, the optimal number of classes was two based on the LMR (p-value = 0.080). The mortality rate in the first class showed a starting point of 31.44 deaths per 100 000 and a slope of -3.02 by 2010. Afghanistan, Algeria, Iran, Oman, Palestine, and Yemen were in this group. The second class had a starting point of 9.00 and a negative slope of 0.84. Other Asian and North African countries were in this class [Figure 3a].
The countries studied in the 5–14 age group were divided into two classes (p-value = 0.090). The first class included Afghanistan, Iran, Kazakhstan, and Kyrgyzstan with the starting point of 10.67 deaths per 100 000 and a slope of -0.27 by 2010. Other regional countries showed a negative trend with the intercept of 6.19 from 1990 and slope of -0.50 [Figure 3b].
Countries studied in the 15–49 age group were divided into two classes (p-value = 0.030). The first class includes Afghanistan, Bahrain, Indonesia, Iran, Kazakhstan, Mongolia, Oman, Saudi Arabia, Thailand, Tanzania, and the UAE. These countries showed a starting point of 34.62 and a negative trend of -0.42 by 2010. Other countries in the region in the second class showed a negative trend with the intercept of 16.00 from 1990 and slope of -0.40 [Figure 3c].
Countries studied in the 50–69 age group were divided into four classes (p-value = 0.030). The first class included Iran, Oman, and Saudi Arabia with the starting point of 79.70 and a rate of change of -0.70 until 2010. The second class had the starting point of 40.60 and slope of -0.50 (including Afghanistan, Bahrain, Indonesia, Kuwait, Maldives, North Korea, Taiwan, UAE, and Qatar). The third class includes Bangladesh, Singapore, and Syria at the starting point of 20.70. The last group with the starting point of 9.10 and slope -0.90 includes all other countries in the region [Figure 3d].
For the over 70s, countries studied in this age group were divided into two classes (p-value = 0.090). The first class includes Iran, Oman, Saudi Arabia, UAE, and the Maldives, which had the starting point 148.23 and a negative trend with a slope of -0.70. Other countries in the region were in the second group showing the intercept of 42.90 from 1990 and an increase with a slope of 0.10. Figure 3 shows changes in each age group over time [Figure 3e].
Figure 3: Estimated trends for road fatalities in the (a) under fives, (b) 5–14, (c) 15–49, (d) 50–69, and (e) over 70s age group in different classes from 1990 to 2010.
Excluding sex and gender, there were four optimal classes. The first three classes had decreasing and negative slopes. The third class (including South Korea and Taiwan) had the highest decreasing slope. However, the first class had a near-zero slope, showing no notable change over time. The fourth class had an increasing slope of 0.30, indicating an increasing mortality rate over time. Afghanistan, Indonesia, Thailand, Iran, the UAE, Saudi Arabia, and Oman lay in class 4. Figure 4 shows changes in both classes over time.
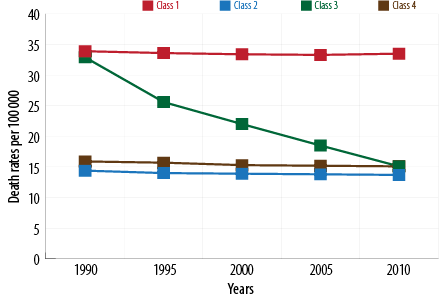
Figure 4: Estimated fatality rate trends in road injury in different classes from 1990 to 2010.
Discussion
The aim of this study was to investigate the trends and rates of traffic deaths in Asian and North African countries from 1990 to 2010. All countries had a decreasing fatality rate of -0.34. Due to natural heterogeneity in the traffic mortality rate, this decreasing rate does not represent a clear view of changes in each country. Some countries in this region that had a decreasing trend in road injury death, and it is better to classify countries by the mortality rates due to road injuries.
As reported by the WHO, the rate of traffic deaths in males is three-times more than females and is the highest difference in the mortality rate between genders among the causes of death.12
The fatality rate due to road injuries in females was less than males in all Asian and North African countries. According to the estimations of starting point mean, females had a lower mortality rate with fewer changes over time. Therefore, in the current study, different models were fitted for both genders. However, given that there were more male deaths most of the analyses were done in this group.
Boniface and colleagues looked at the mortality rate in Tanzania in 2014. They reported that 76% of deaths (4 775 individuals) occurred in males with 70% of these occurring in 18–45 year olds.13
According to Bull study on mortality rate and pattern of changes (2001 to 2005), about 65% of traffic deaths occurred among males aged 15–59.14
In a study on the distribution of deaths by age and gender from 1996 to 2006, Chang showed that the mortality rates for all age groups in men was higher than women.15 In our study, the highest mortality rate was seen in the 41–55 age group. The mortality rates in people under 16 in both genders were the same, but the 51–55 year age group had an increasing trend. Irrespective of gender, the 16–25 and over
65 age group showed the highest number of deaths due to road accidents.15
In 1993, Massie et al showed that risk of fatal accidents in young drivers (16–19 years old) and drivers over 70 was 3- to 3.8-times greater than the average.16
A study conducted in Malaysia showed that children and elders have a higher risk of death due to road accidents.17 Hamzesh et al, reported that 76% of deaths from road accidents in Iran are males.18
Since the data in our study was adjusted in each age group, the death rate was highest in the over 70s followed by the 50–69 year age group. The lowest mortality rate was in the 5–14 age group with an average of six deaths per 100 000 individuals.
In the age groups in different classes the trends are almost constant. Countries with high mortality rates in 1990 show a gentle slope until 2010, and the trends remain constant. In all age groups, the UAE, Iran, Oman and Saudi Arabia have the highest death rate overall, and in both genders.
Another study by Mokdad et al, using IHME data revealed that lifelong disability index caused by road injuries experienced an increase of 34% from 1990 to 2010.19 In general, despite ascending and descending trends in the rate of deaths in road accidents in men and women, based on GMM, the countries in each have a flat rate.
Data on road traffic fatalities are essential for monitoring country-level trends, tailoring prevention efforts, assessing progress, and comparing the scale of road traffic deaths relative to deaths from other causes.
Registration data fulfill these needs best as they are a record of all officially registered deaths and are not time-limited. For example, a person who dies from injury complications a few months after a road traffic crash may or may not be issued with a death certificate showing the road traffic injury as the contributing cause of death.
We used the IHME database for this study due to the lack of other sources of data on the death rates in all countries. The lack of accurate and reliable data can be considered a limitation of this study, and further studies are needed into the availability and generation of registered mortality data.
Interventions that developed countries have used to prevent road accident fatalities could be used for developing countries. These include passing laws making the use of seatbelts and child seats compulsory and determining speed limits. Additionally, for those road injuries that do not lead to death the DALY index (the number of days lost due to disability) should also be included in road injury analysis.
Conclusion
Reporting of road injury mortality rates vary substantially from country to country and low reporting rates in developing countries may be due to weaknesses in the healthcare and epidemiological systems. Our study highlights that defined classes based on these models may be better than classification based on other features such as geographical classification, which is implemented in the GBD study.
Disclosure
The authors declared no conflicts of interest. No funding was received for this study.
references
- 1. Mansuri FA, Al-Zalabani AH, Zalat MM, Qabshawi RI. Road safety and road traffic accidents in Saudi Arabia. A systematic review of existing evidence. Saudi Med J 2015 Apr;36(4):418-424.
- 2. Petersen PE. The World Oral Health Report 2003: continuous improvement of oral health in the 21st century–the approach of the WHO Global Oral Health Programme. Community Dent Oral Epidemiol 2003 Dec;31(Suppl 1):3-23.
- 3. Puvanachandra P, Hyder AA, Allen KA. Road traffic injury and trauma care: Innovations for policy (road trip). Report of the Road traffic injury and trauma care working group. WISH road traffic injury report. 2013.
- 4. Odero W, Khayesi M, Heda PM. Road traffic injuries in Kenya: magnitude, causes and status of intervention. Inj Control Saf Promot 2003 Mar-Jun;10(1-2):53-61.
- 5. World Health Organization. Global status report on road safety 2013: Supporting a decade of action. 2013.
- 6. Putignano C. Trends of road accidents in Italy 1996–2005. IATSS Res 2007;31(1):134-137.
- 7. World Health Organization. Decade of action for road safety 2011–2020 global launch. 2011.
- 8. Ganesalingam S, McLachlan GJ. The efficiency of a linear discriminant function based on unclassified initial samples. Biometrika 1978;65(3):658-665.
- 9. Nylund KL, Asparouhov T, Muthén BO. Deciding on the number of classes in latent class analysis and growth mixture modeling: A Monte Carlo simulation study. Struct Equ Modeling 2007;14(4):535-569.
- 10. Zayeri F, Sheidaei A, Mansouri A. Clustering asian and north african countries according to trend of colon and rectum cancer mortality rates: an application of growth mixture models. Asian Pac J Cancer Prev 2015;16(9):4115-4121.
- 11. Wang J, Wang X. Structural equation modeling: Applications using Mplus: John Wiley & Sons; 2012.
- 12. World Health Organization. Gender and road traffic injuries. 2002.
- 13. Boniface R, Museru L, Kiloloma O, Munthali V. Factors associated with road traffic injuries in Tanzania. Pan Afr Med J 2016 Feb;23(1):46.
- 14. Bull J. The injury severity score of road traffic casualties in relation to mortality, time of death, hospital treatment time and disability. Accid Anal Prev 1975;7(4):249-255.
- 15. Chang D. Comparison of crash fatalities by sex and age group. 2008.
- 16. Massie DL, Campbell KL. Analysis of accident rates by age, gender, and time of day based on the 1990 nationwide personal transportation survey. Final report. 1993.
- 17. Kareem A. Review of global menace of road accidents with special reference to Malaysia- a social perspective 2003;10(2):31-39.
- 18. Hamzeh B, Najafi F, Karamimatin B, Ahmadijouybari T, Salari A, Moradinazar M. Epidemiology of traffic crash mortality in west of Iran in a 9 year period. Chin J Traumatol 2016 Apr;19(2):70-74.
- 19. Mokdad AH, Jaber S, Aziz MI, AlBuhairan F, AlGhaithi A, AlHamad NM, et al. The state of health in the Arab world, 1990-2010: an analysis of the burden of diseases, injuries, and risk factors. Lancet 2014 Jan;383(9914):309-320.