Birth weight (BW) is a widely used and much-studied biomarker of health, survival, and the future development of infants. Studies have demonstrated that low birth weight (LBW), defined as a BW less than 2,500 grams, is associated with a higher risk of neonatal and infant mortality and morbidity, and a greater risk for adverse health outcomes, cognitive development, and school performance problems than those born a normal weight.1-8 Recent studies have documented a strong relationship between extremely low birth weight (ELBW), defined as BW less than 1,500 grams, or LBW and poor school performance and behavioral problems.2,9-16 Findings also revealed that while educational difficulties in mathematics and reading are relatively common among ELBW or LBW children, problems in language, spelling, and handwriting are also evident.17-22
Globally, the infant mortality rate has reduced considerably over the last few decades, particularly in developed countries. A major part of this is due to a reduction in neonatal mortality caused by advancement in medical technology.23,24 At the same time, the number of ELBW or LBW children in the world have progressively increased due to the increasing survival rate of ELBW or LBW infants and the increase in the LBW rate. With recent advances in modern obstetric and neonatal care and technological development, high-risk neonates with LBW or preterm birth have a greater chance of survival in the newly formed intensive care units. As a result, more small and LBW babies and premature births are live births and a high proportion of these infants survive. This has also caused an increase in the rate of LBW infants and, subsequently, an increased rate of long-term neurological problems. Hack et al,8 observed that although a large group of LBW infants are leading a normal and healthy life, as a group they have higher rates of subnormal growth, adverse health conditions, and developmental problems.
Similar to other developed countries, Oman has also experienced a dramatic improvement in the health and survival of infants and children due to improvement in the standard of living, health care technologies, and health care services since 1970. The country has a well-organized, universal, free health care system providing access to health care for all of its citizens, which is widely recognized and acclaimed by various international organizations, including the World Health Organization (WHO).25 As a result, almost all the health indicators witnessed dramatic improvements over the past four decades, and several diseases have been eliminated from the country. Oman has also made impressive gains in the achievement of key millennium development goals.26 Despite this improvement in health status, concerns have been raised about some childhood health indicators, particularly LBW and infant mortality, for their unchanging or increasing trends as indicated by Ministry of Health data.27,28 Concerns have also been raised due to the rising burden of lifestyle-related non-communicable diseases, which have emerged as a new health challenge for the country.29
The infant mortality rate in Oman dropped from 118 per 1000 live births in 1970 to 10.3 per 1000 live births in 2005, a decline of 91% in 35 years. However, since 2005, the infant mortality rate in Oman remains around 10%.28 On the other hand, compared to any developed country, Oman has a relatively high LBW rate, which is around 10% since 2010.27 Despite the improvements in health care services and medical technology, LBW rates have shown increasing trends since 1980.28 According to the National Health Information Statistics (NHIS), the prevalence of LBW was 4.2% in 1980, which doubled (8.1%) in 2000. Since, it has shown a slow but steady increase reaching 10.2% in 2013. Over the last decade, infant mortality rates have remained virtually stable while the LBW rate has increased substantially. One recent study argued that the leveling of infant mortality in Oman was linked with the increasing rate of LBW and preterm births.28
Recent child health statistics indicated that the ability of the country to prevent LBW has shown no improvement, but the ability to increase the survival of LBW children has increased considerably. As a result, the country has increased the number of children who are LBW survivors. Many of these children are now attending school. It is important to investigate how these children are coping in school, and identify further information about their health, mental, and scholastic development in early childhood. Therefore, the objective of this study was to examine how well LBW children perform in school in different areas of school curriculum, compared to a group of children with normal birth weight (NBW; ≥2.5kg), controlling for the effects of potential risk factors of LBW.
Our study is likely to improve upon the previous literature in several ways. Firstly, we have utilized a unique data set extracted from the birth certificate, health cards, and school registers of school going children, which were made available by selected school administration. We obtained BW and other health, demographic and socioeconomic data of schoolchildren from their birth certificates and health cards and their school performance from school registers. Unlike data from any retrospective survey, data from school records and health cards are likely to be free from reporting bias and memory lapses. Secondly, we examined the curriculum and classroom-based school performance of the children as evaluated by their teachers rather than laboratory-based test scores.
Methods
The data for this study was extracted from a unique database, readily available in every elementary school in Oman. The database linked information from health cards and academic records and behavioral performance of the children. The information in health cards and academic and behavioral performance records are mainly available in the form of hard copies with the school administration. However, some schools maintain both soft and hard copies of the information.
In Oman, it is mandatory to submit the birth certificate and health card of the children at the time of first admission to any school. All the schools retain the copy of the birth certificates and health cards of the students for future use. The health card contains useful information about the health of the child and socioeconomic and demographic information of the parents and the family. Since Oman has a universal free health care system,25 almost all deliveries occur in health facilities27 and the BW of newborn babies are recorded by health personnel. At the time of discharge from the hospital, a child health card with BW and other socio-economic, demographic, and health information about the mother and infant are issued. Previous studies have found that BW data from health cards are more reliable than maternal recalled BW.30,31
The school administration maintain a standardized register to record the performance of each child in different areas of learning. The record of school performance in different areas are prepared by teachers based on their observation and school-administered curriculum-based tests. Teachers prepared these records quarterly and annually. The annual scores were based on the cumulative scores for the whole year. For our study, we considered the annual scores since each student is rated by multiple teachers, and the annual score is more likely to provide a reliable measure of the child’s performance.
There are many advantages of using the school database. Firstly, the information is free from bias and memory lapses. Since the health and demographic information about each child was recorded on the health card by the trained health personnel, it is likely to be more precise than the self-reported information collected through interviewing mothers or guardians or teachers. A second advantage of this data set is that the school outcome measurements are based on multiple assessments of the child by a group of teachers on various items, allowing multiple indicators for school performance and behavior. A third advantage of the data set is that it is a relatively inexpensive data source for conducting research on certain aspects of school children. To our knowledge, this database has never been explored in Oman in any study. The database could be used as a baseline information for a further follow-up study.
The data collection occurred between September and November 2013. We confined our data collection to schools in the Muscat Governate. Both public and private schools were considered in the sample. Therefore, the study is based on a sample of the school drawn from purposively selected areas. However, the selected schools and the students are likely to represent the typical Omani society as schools in Muscat include people from all strata of Omani society and a large number of expatriates.
We gathered data from eight schools within the Muscat region and one in A’Dhahirah — a remote mountainous interior area of Oman. Out of the nine selected schools, three were private schools.
Our study population consisted of school children aged 7–11 years old who had completed grades 2–4 so that their academic performance records were available. The number of students with eligible criteria varied with the size of the school, which ranged from 25 to 110 pupils. We collected complete information for 542 students. The sample size was expected to yield valid estimates of major indicators of the study with less than 5% error margin and more than 95% confidence limit.
A questionnaire was used to gather the relevant information and was designed accordingly to the available information from school registers and health cards. This study was approved by the Department of Mathematics and Statistics, and College of Science Administration of the Sultan Qaboos University (SQU). The respective school administration gave permission to collect and use the school databases. All names and identities were kept anonymous.
Table 1 lists the outcome or dependent variables used. In total, there were six dichotomous dependent variables representing school performance of children on different aspects: Arabic language, math, science, information technology (IT), behavior, and sports. The behavior variable indicate whether the child had emotional or behavioral problems. While evaluating language performance, teachers evaluated the listening, reading, writing, and speech of the students separately. Similarly, for mathematics and science, teachers evaluated the understanding and problem-solving capacity of the pupils. For IT, teachers scored on knowledge and skill of performance. In the case of sports, teachers observed their movement and basic skills. Teachers also evaluated the mental, emotional, communicative, and behavioral aspects of students. In order to characterize the behavior of a student, teachers used a series of items such as “temper”, “dependent on others”, “confused” and so on, for rating their performance. While evaluating the performance of a student, no standard rating score was used. Teachers provided their subjective views about a student’s performance on a particular subject. They rated their performance on a 5-point Likert scale, designating a score of one as unacceptable and five as excellent. Three was considered an average score. Scores were on the basis of their observation in-class activities and outside-class activities as well as written tests and practical performance. If a child was rated below average on a particular aspect of performance, we gave the category code 1, otherwise the child was coded 2.
Table 1: Description of the six dependent variables assessed.
|
Behavior |
Child had poor emotional or behavioral problems |
1=Yes
2=No |
9.4 |
|
Language |
Child’s performance in Arabic reading and writing was rated as below average |
1=Yes
2=No |
15.7 |
|
Math |
Child’s performance on knowledge, understanding, and problem solving in arithmetic was rated as below average |
1=Yes
2=No |
16.4 |
|
Science |
Child’s performance on knowledge, understanding, and problem solving in science was rated as below average |
1=Yes
2=No |
16.8 |
|
Information technology |
Child’s performance on knowledge, understanding, and problem solving in information technology was rated as below average |
1=Yes
2=No |
10.7 |
Table 2: Characteristics of the study population.
|
Total |
542 |
100.0 |
|
Birth weight§ |
|
|
|
<1.5 kg (ELBW)* |
15 |
2.8 |
|
<2.5 kg (LBW)* |
96 |
17.7 |
|
≥2.5 kg (NBW)* |
446 |
82.3 |
|
School type |
|
|
|
Public |
435 |
80.3 |
|
Private |
107 |
19.7 |
|
Place of residence |
|
|
|
Muscat |
436 |
80.4 |
|
A’Dhahirah |
106 |
19.6 |
|
Gender |
|
|
|
Boy |
260 |
48.0 |
|
Girl |
282 |
52.0 |
|
Age (years) |
|
|
|
7–9 |
372 |
68.6 |
|
10–11 |
170 |
31.4 |
|
Mean |
8.9 |
|
|
Birth order |
|
|
|
1 |
116 |
21.4 |
|
2–4 |
274 |
50.6 |
|
5+ |
152 |
28.0 |
|
Mean |
3.6 |
|
|
Birth interval |
|
|
|
<2 years |
72 |
13.3 |
|
≥2 years |
470 |
86.7 |
|
No. of children in family |
|
|
|
1–2 |
173 |
31.9 |
|
3–4 |
187 |
34.5 |
|
5+ |
182 |
33.6 |
|
Mean |
4.0 |
|
|
Economic status |
|
|
|
Low-income |
115 |
21.2 |
|
Middle-high income |
427 |
78.8 |
|
Mother’s education |
|
|
|
No education |
85 |
15.7 |
|
Less than secondary |
137 |
25.3 |
|
Secondary and above |
320 |
59.0 |
|
Mother’s employment |
|
|
|
House-wife |
395 |
72.9 |
|
Employed |
147 |
27.1 |
|
Father’s education |
|
|
|
No education |
47 |
8.7 |
|
Less than secondary |
96 |
17.7 |
§ Extremely low birth weight (ELBW) and low birth weight (LBW) are overlapping and the percentages of all categories cannot be added to 100.
* NBW: normal birth weight.
The independent or explanatory variables included in the study were: BW, categorized as LBW (<2.5kg) and NBW (≥2.5kg), gender, age, type of school (public or private), place of residence (Muscat or A’Dhahirah), birth interval, birth order, number of children in the family, family economic status, mother’s level of education, mother’s employment status, and father’s level of education. The age and BW of participating children were determined from birth certificates and health cards. The self-reported economic status of the family was recorded in the school database as below average, good, or excellent. The reported average monthly income was also recorded. Following the suggested categories of family economic status by the Ministry of National Economy in Oman32 and used in another study,33 families were classified as low income if the reported monthly average income was less than OMR 500 (equivalent to USD 1300) and middle-high income family if the reported monthly average income was more than OMR 500.
The socioeconomic and demographic characteristics of all children were analyzed by frequency distribution. Bivariate associations between independent variables and dependent variables were analyzed using cross tabulation and the chi-square test. Since our outcome variables were dichotomous, we employed binary logistic regression analysis to identify the effect of a factor on different items of school performance, using univariate and multivariate logistic regression analysis. While univariate logistic regression provides on unadjusted effect or bivariate association between LBW and each of the outcome variables without controlling the effect of other potential confounders, multivariable logistic regression analysis provides adjusted independent effects of factors by eliminating the effects of other potential confounders. The strength of association was estimated by odds ratio (OR) and the corresponding 95% confidence intervals (CI). Factors with a p-value <0.050 were taken as statistically significant.
Results
The distribution of children according to their selected background characteristics are given in Table 2. Of the total 542 children included in this study, 15 (2.8%) were ELBW, 96 (17.7%) were LBW and 446 (82.3%) were NBW children. The LBW category of children also include ELBW children. The incidence of ELBW comprised of 15.8% of the total LBW. The mean BW was estimated to be 2.97±0.62kg, and median BW was 3.04kg. Male children had a slightly higher mean BW than female children (2.98kg vs. 2.95kg), but the difference was not statistically significant (p=0.772). Figure 1 shows the shape of the distribution of birth weights of our sample students, which was approximately normal with a slight negative skewness (-0.56).
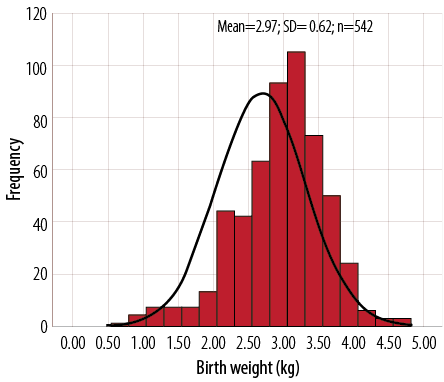
Figure 1: Distribution of birth weight in 542 school children. The normal distribution is also shown.
The majority (80%) of the children were from public school and the Muscat region. More than half (52%) were girls. More than two-third (69%) of the students were aged 7–9 years old and the rest (31%) were aged 10–11 years old. The average age was about nine years old. One-fifth (21%) of the children were firstborns (birth order one). The average birth order was 3.6. About 13% of the children were born with a birth interval less than two years and 87% had a birth interval of two years or more.
Nearly one-third (32%) of the children in the sample came from families having 1–2 children. The average number of children per family was four. Data from school record indicated that more than two-thirds (78%) of the children came from middle-high income families and 21% from low-income families. Most of the children had literate parents, with a secondary level or above education.
Overall, 12% of the children had below average school performance. The performance level varied across the six selected items of school outcome measures [Table 3]. The highest rate of under achievement was observed in science (17%), closely followed by arithmetic and language (16% each), IT (11%), behavioral problems (9%), and the least in sports (5.4%).
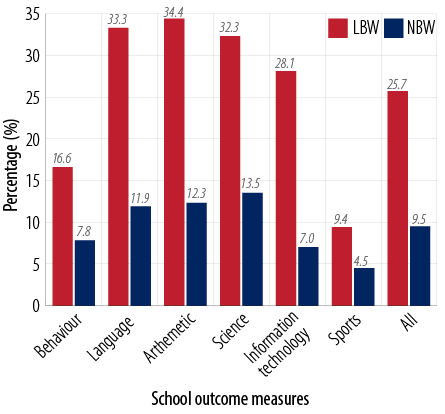
Figure 2: Percentage of low birth weight (LBW) and normal birth weight (NBW) children with below average performance in six domains of school outcomes.
BW showed significant differential effects on all the items of school performance and behavior of children. Overall, one-fourth (25.7%) of the children with LBW had a below-average performance compared to 9.5% of the children with NBW [Figure 2]. It is clear that LBW children had a two- to four-times higher rate of difficulties or below average performance in different school outcomes and behavior measures. For example, one in every three (34.4%) children with LBW had a below average school performance in math compared to one in every eight (12.3%) children with NBW.
Table 3: Percentage of children with below average school performance on different items according to background characteristics.
|
Total |
9.4 |
15.7 |
16.4 |
16.8 |
10.7 |
5.4 |
12.4 |
|
Birth weighta, b,c,d,e,f |
|
LBW |
16.6 |
33.3 |
34.4 |
32.3 |
28.1 |
9.4 |
25.7 |
|
NBW |
7.8 |
11.9 |
12.3 |
13.5 |
7.0 |
4.5 |
9.5 |
|
Types of schoola,c,d,e,f |
|
Public |
10.6 |
16.6 |
19.8 |
18.9 |
12.6 |
6.7 |
14.2 |
|
Private |
4.7 |
12.1 |
2.8 |
8.4 |
2.8 |
0.0 |
5.1 |
|
Place of residencea,e |
|
|
|
|
|
|
|
|
Muscat |
10.6 |
16.7 |
16.7 |
16.1 |
9.4 |
5.0 |
12.4 |
|
A’Dhahirah |
4.7 |
11.3 |
15.1 |
19.8 |
16.0 |
6.6 |
12.3 |
|
Gendera,b |
|
Boy |
11.5 |
19.2 |
17.7 |
19.2 |
10.4 |
4.2 |
13.7 |
|
Girl |
7.4 |
12.4 |
15.2 |
14.5 |
11.0 |
6.4 |
11.2 |
|
Agec,e |
|
|
|
|
|
|
|
|
7–9 |
8.6 |
16.4 |
18.8 |
16.9 |
12.1 |
5.9 |
13.1 |
|
10–11 |
11.2 |
14.1 |
11.2 |
16.5 |
7.6 |
4.1 |
10.8 |
|
Birth order |
|
1 |
6.0 |
14.7 |
16.4 |
18.1 |
11.2 |
3.4 |
11.6 |
|
2–4 |
10.9 |
15.7 |
15.0 |
14.6 |
8.0 |
4.4 |
11.4 |
|
5+ |
9.2 |
16.4 |
19.1 |
19.7 |
15.1 |
8.6 |
14.7 |
|
Birth interval (years) |
|
<2 |
12.7 |
16.9 |
21.2 |
19.5 |
12.7 |
4.2 |
14.5 |
|
≥2 |
8.5 |
15.3 |
15.1 |
16.0 |
10.1 |
5.7 |
11.8 |
|
Family size |
|
1–2 |
11.0 |
16.8 |
15.6 |
16.8 |
11.6 |
4.0 |
12.6 |
|
3–4 |
8.0 |
10.7 |
14.4 |
13.4 |
5.9 |
4.3 |
9.5 |
|
5+ |
9.3 |
19.8 |
19.2 |
20.3 |
14.8 |
7.7 |
15.2 |
|
Economic statusb,c,d |
|
Low-income family |
8.6 |
24.8 |
22.2 |
23.5 |
13.6 |
2.5 |
15.9 |
|
Middle-high income family |
7.9 |
14.2 |
15.2 |
14.9 |
10.5 |
6.0 |
11.5 |
|
Mother’s educationb,c,d,e |
|
Less than secondary |
9.5 |
20.7 |
21.2 |
22.5 |
15.3 |
6.3 |
15.9 |
|
Secondary and above |
9.4 |
12.2 |
13.1 |
12.8 |
7.5 |
4.7 |
10.0 |
|
Mother’s employmentb,c,d |
|
House-wife |
9.6 |
17.7 |
18.2 |
19.2 |
11.9 |
6.1 |
13.8 |
|
Employed |
8.8 |
10.2 |
11.6 |
10.2 |
7.5 |
3.4 |
8.6 |
|
Father’s educationb,d,e |
|
Less than secondary |
12.6 |
21.0 |
18.9 |
22.4 |
15.4 |
6.3 |
16.1 |
|
Secondary and above |
8.3 |
13.8 |
15.5 |
14.8 |
9.0 |
5.0 |
11.1 |
a Indicates significant effect (p<0.050) on behavioral difficulties; b indicates significant effect (p<0.050) on language difficulties; c indicates significant effect (p<0.050) on arithmetic difficulties; d indicates significant effect (p<0.050) on science difficulties; e indicates significant effect (p<0.050) on information technology (IT) difficulties; f indicates significant effect (p<0.050) on sports difficulties
The school type, place of residence, and gender of children showed significant association with behavioral problems [Table 3]. Reading and writing difficulties in Arabic language was associated with gender, family economic status, mother’s education and employment, and father’s education. Difficulty with math was significantly associated with school type, child’s age, economic status, and mother’s education and employment status. Difficulty in science was significantly associated with school type, economic status, father’s education, and mother’s education and employment status. IT difficulties showed significant association with types of school, place of residence, the age of the child, mother’s education, and father’s education. Sports difficulties showed significant association with school type only. Birth order, birth interval, and number of children in the family showed no significant association with school performance and behavior.
With the exception of sports and IT, boys showed a higher rate of difficulties in the other four areas of school performance than girls. However, the gender differences were significant for behavioral problems and Arabic language. Students studying in public schools showed a higher rate of difficulties in all areas of school performance and behavior than those of the students from private schools. Age was negatively associated with all areas of school performance except behavior. However, the differences were statistically significant for arithmetic and IT. Children from low-income families had a poorer performance in all areas of school outcomes, except sports, than children from families with middle-high income. The mother’s education showed significant negative association with difficulties in language, arithmetic, science, and IT. For example, 12% of children with mothers having a secondary level and above of education had difficulties in reading and writing in Arabic compared to 20.7% of children with mothers having no or less than secondary education. Maternal employment also showed significant association with school performance. Children whose mothers were employed were found to have fewer difficulties in all areas of school performance except sports, but the differences were statistically significant for language, math, and science. The father’s education also showed a negative association with below average school performance in all areas. However, the differences were significant for language, arithmetic, and science.
Table 4 shows the unadjusted and adjusted effects of LBW and the six outcome measures of school performance. Each row in the table represents one result for a separate outcome variable. For each of the dependent variable (school performance) presented, the unadjusted OR and the adjusted OR (AOR) represent the estimated unadjusted and adjusted effects of LBW on the dependent variables. The results indicate that the LBW children were two- to six-times more likely to have difficulties or poorer performance than their NBW peers across the six areas of school performance. The highest effect of LBW (around six-times) was found on IT performance followed by language (around five-times) and lowest on sports performance (two-times). However, both the unadjusted and adjusted effect of LBW on sports performance appeared as statistically insignificant at 5% level of significance but significant at 10% level of significance (AOR=2.26, 95% CI 0.92–6.87; p=0.070). Further, the AOR remained high or even higher than the unadjusted OR in almost all the areas of school performance. This indicates that the magnitude of the effect of LBW remained high even after controlling the effects of potential confounders and, thus, have independent effects of LBW on school performance.
Children born with LBW had a four-times significantly higher risk of language difficulties than the children born with NBW. After adjustment for socioeconomic and demographic factors, the association remained significant, and the adjusted effects slightly increased (AOR=4.96, 95% CI 2.67–8.92). This indicates that LBW has significant independent effects on language performance. Both unadjusted and adjusted analysis indicate that LBW children had a six-times higher risk of below average performance in IT than their NBW peers (AOR=6.42, 95% CI 3.87–13.24; p<0.001). As were the cases with IT and language difficulties, LBW children were found to have more than four-times higher risk of below average performance in arithmetic and science than NBW children. Children born with LBW had more than two-times higher risk of behavioral problems than NBW children (AOR=2.72, 95% CI 1.27–6.01; p=0.013).
Table 4: The effect of low birth weight on school performance of children: logit results.‡
|
Language |
4.00 |
2.43–6.55 |
<0.001 |
4.96 |
2.67–8.92 |
<0.001 |
|
Math |
3.64 |
2.23–5.95 |
<0.001 |
4.01 |
2.16–7.71 |
<0.001 |
|
Science |
3.71 |
2.28–6.04 |
<0.001 |
4.50 |
2.45–7.27 |
<0.001 |
|
Information technology |
5.80 |
3.28–10.24 |
<0.001 |
6.42 |
3.87–13.24 |
<0.001 |
|
Behavior |
2.58 |
1.39–4.75 |
0.002 |
2.72 |
1.27–6.01 |
0.013 |
‡ The logit contained all independent variables from Table 4. The odds ratios (OR) represent the effect of low birth weight (LBW) on school outcomes or performance variable, holding all other socioeconomic and demographic variables constant.
Discussion
We sought to examine the effect of LBW on selected domains of school performance and behavioral outcomes of elementary school children in grades 2–4. While previous studies were concerned with the effects of ELBW or LBW in children in developed countries, the studies relied mostly on standardized laboratory-based measures of academic achievement rather than actual school outcomes. This study presents the experience of a newly developed country using a range of actual school performance measures based on teachers’ reports and school curriculum-based tests using a unique database from health cards and school registers. This data source could effectively be used as a baseline information for designing further follow-up studies.
Data from school registers revealed a very high estimate of LBW (17.7%) among the school-going children aged 7–11 years in Oman. The NHIS reported an estimate of 10% of infants with LBW in Oman.27 However, the two estimates are not comparable. Our estimate based on a selective group of schoolchildren comprising both Omani nationals and expatriates while the NHIS estimate considered Omani nationals only.
Overall, 12% of children aged 7–11 years had difficulties or below average performance, irrespective of their birth weight. The rate varied from 5 to 17% across the six outcome measures, with the highest rate of below average performance in science (17%), followed by maths and Arabic language (each 16%), IT (11%), and behavior (9%). The lowest rate was in sports (5%). The BW of the children revealed a significant effect on the school performance. One in every four (25.7%) LBW children was an underachiever in different aspects of school performance. The corresponding figure for NBW children was one in ten (9.5%). The rate of poor performance in all six of school outcome measures were significantly higher among the LBW children compared to NBW children. For example, between 9%–34% of children with LBW were identified as having poor levels of school performance. The comparable figures for the NBW children were 5–14%.
Our results are consistent with the findings of the previous studies. A similar study in New Zealand found that 20–40% of the children with ELBW exhibited high levels of behavioral problems, cognitive impairment and poor school achievement as opposed to 7–20% of a control cohort.34 Another follow-up study on a cohort of 14-year-old school children in Australia reported that the rate of under achievement on various item of school performance and behavior ranged between 11% to 34% among ELBW children, as opposed to 3% to 19% among NBW children.35 A study using linked birth certificates and school records from Florida found that the risk of specific school-identified disabilities increased as BW decreased.12 A large hospital-based study of LBW children at nine years of age found a two-fold increase in school difficulties compared to their NBW peers.36
Our study demonstrated significant adverse effects of LBW on school performance and behavior. Compared with the NBW children, LBW children showed clear and consistent tendencies towards poorer levels of performance across all the selected domains of school outcomes. These differences persisted even after controlling the effects of other socioeconomic and demographic factors. Our analysis indicated that LBW children were two- to six-times more likely to have poorer school performance than their NBW peers. The findings are consistent with a growing body of research evidence, suggesting that LBW children have academic deficit compared to NBW children.14,37-40
Although it was not the primary focus of our study, we observed significant differential effects of parental education, economic status, school type, and age of children in school performance and behavior. Most of these factors remained significant even after controlling the effect of BW and other confounders (data not shown), indicating significant independent effect of these factors on academic performance of children. A recent study on undergraduate students of SQU demonstrated that parents’ education, rather than economic status, had a positive impact on the academic performance of their children.41 It is likely that children born in families with literate parents enjoy a better academic atmosphere, which would have stimulating effects on their academic performance as educated parents are aware of value of education and can support their children with educational difficulties.
Our unadjusted bivariate analysis revealed significant differential effects of mother’s employment status on school performance in Arabic language, math, and science; however, the adjusted analysis using multivariate logistic regression showed no significant association. This might be because the effect of maternal employment is intertwined with economic status, education or school type. It is likely that employed mothers have better economic status and a higher level of education and can afford private school for the education of their children.
Most children with poor school performance were prone to grade repetition or dropout from school. One study in the United States showed that students who were retained for a grade in school were at least 20% more likely to drop out of school than those who were not retained.42 A previous study on school failure of Omani girls revealed that 23% of the elementary school girls had failed at least once during the previous years and 25% of them had failed in more than one year.43 Obviously, the rate of failure for LBW children could be higher. However, while gathering data from school registers, we did not find any information about grade repetition or failure. This may be because elementary schools in Oman, in recent times, pass all the students without failure. Given this prevailing situation of autopromotion of the students with a poor academic performance at school level might have negative consequences on quality of education. This might be linked to the increased rate of grade repetition and drop-out in SQU, which is close to double figures and is increasing.44 The rate of grade repetition or on probation is one in every four students (23%).41 More in-depth studies are needed to identify the causal link between the high rate of grade repetition and the dropout rate in the SQU and the all-pass system in elementary schools in Oman. Grade repetition or failure at any level has immediate economic and social consequences to the country and families. The cost of grade repetition or dropout in Oman has special significance because education in Oman, particularly in public institutions, is free of cost from kindergarten to a higher level.45 A study in the USA demonstrated that the average cost of repeating a grade is over $4000 per child per year.46 However, the lifetime costs of poor school achievement are many times higher. Poor school performance leads to poor adult outcomes in every aspect of life, such as lower lifetime earnings, and requires more social services.14 All these findings indicate that by reducing or preventing adverse pregnancy outcomes like LBW can bring large savings in cost of health, education, and social services. Thus, parents and educational institutions should be aware of the educational needs of LBW children and their other health problems.
This study is not free from methodological limitations. First, the study is based on a relatively small sample drawn from only two areas, which could limit the generalization of the results. Second, in the absence of any standard scale of measurement of some of the characteristics of the outcome measures assessed by teachers subjectively, for example, the behavioral problems of the children. Nevertheless, the study is likely to enrich the literature, providing baseline information for further study and may have important policy implications for Oman.
Conclusion
Since the poor school outcomes of LBW children have economic and social consequences that go beyond the immediate health care and special education costs and may have lifetime effects,14,47 an attempt should be made to reduce or prevent poor pregnancy outcomes. In turn, this would reduce the cost of health, education, and social services. Intensive monitoring during the course of pregnancy by providing adequate prenatal medical care might be one means of prevention of adverse pregnancy outcomes like LBW. Also, early intervention programs or special care for LBW children in school could be an effective means of improving the educational outcome and behavior of these children. It is also important to increase awareness among parents, teachers, and the community about the higher risk of low school performance of LBW children.
Disclosure
This study is an outcome of a final year project of a student of the Department of Mathematics and Statistics of Sultan Qaboos University. The school in A’Dhahirah was selected because the designated undergraduate project student who was involved with data collection had easy access to data collection as an ex-student of the school. No funding was received for this study.
Acknowledgements
The authors would like to thank Ms Sara Khasib Al-Majrafi for her help in gathering and organizing data for the study and the Sultan Qaboos University, particularly the College of Science Administration and Department of Mathematics and Statistics, for facilitating the study. A special thanks goes to the principals, teachers, and administrative staff of the participating schools for the help and cooperation they provided during the data collection that made this work possible.
references
- McCormick MC. The contribution of low birth weight to infant mortality and childhood morbidity. N Engl J Med 1985 Jan;312(2):82-90.
- McCormick MC, Brooks-Gunn J, Workman-Daniels K, Turner J, Peckham GJ. The health and developmental status of very low-birth-weight children at school age. JAMA 1992 Apr;267(16):2204-2208.
- Paneth NS. The problem of low birth weight. Future Child 1995;5(1):19-34.
- Pallotto EK, Kilbride HW. Perinatal outcome and later implications of intrauterine growth restriction. Clin Obstet Gynecol 2006 Jun;49(2):257-269.
- Strauss RS. Adult functional outcome of those born small for gestational age: twenty-six-year follow-up of the 1970 British Birth Cohort. JAMA 2000 Feb;283(5):625-632.
- Boardman JD, Powers DA, Padilla YC, Hummer RA. Low birth weight, social factors, and developmental outcomes among children in the United States. Demography 2002 May;39(2):353-368.
- Case A, Fertig A, Paxson C. The lasting impact of childhood health and circumstance. J Health Econ 2005 Mar;24(2):365-389.
- Hack M, Taylor HG, Klein N, Eiben R, Schatschneider C, Mercuri-Minich N. School-age outcomes in children with birth weights under 750 g. N Engl J Med 1994 Sep;331(12):753-759.
- Reichman NE. Low birth weight and school readiness. Future Child 2005;15(1):91-116.
- Roth J, Figlio DN, Chen Y, Ariet M, Carter RL, Resnick MB, et al. Maternal and infant factors associated with excess kindergarten costs. Pediatrics 2004 Sep;114(3):720-728.
- Pinto-Martin JA, Whitaker A, Feldman J, Cnaan A, Zhao H. Rosen-Bloch, McCulloch, D, & Paneth N. Special education services and school performance in a regional cohort of low birth weight infants at age nine. Paediatr Perinat Epidemiol 2004;18:120-129.
- Avchen RN, Scott KG, Mason CA. Birth weight and school-age disabilities: a population-based study. Am J Epidemiol 2001 Nov;154(10):895-901.
- Andrews H, Goldberg D, Wellen N, Pittman B, Struening E. Prediction of special education placement from birth certificate data. Am J Prev Med 1995 May-Jun;11(3)(Suppl):55-61.
- Corman H, Chaikind S. The Effect of Low Birthweight on the School Performance and Behavior of School-Aged Children. Econ Educ Rev 1988;9(3):307-316.
- Wocadlo C, Rieger I. Social skills and nonverbal decoding of emotions in very preterm children at early school age. Eur J Dev Psychol 2006;3:48-70.
- Pritchard VE, Clark CA, Liberty K, Champion PR, Wilson K, Woodward LJ. Early school-based learning difficulties in children born very preterm. Early Hum Dev 2009 Apr;85(4):215-224.
- Johnson EO, Breslau N. Increased risk of learning disabilities in low birth weight boys at age 11 years. Biol Psychiatry 2000 Mar;47(6):490-500.
- Litt J, Taylor HG, Klein N, Hack M. Learning disabilities in children with very low birthweight: prevalence, neuropsychological correlates, and educational interventions. J Learn Disabil 2005 Mar-Apr;38(2):130-141.
- Saigal S, Hoult LA, Streiner DL, Stoskopf BL, Rosenbaum PL. School difficulties at adolescence in a regional cohort of children who were extremely low birth weight. Pediatrics 2000 Feb;105(2):325-331.
- Bhutta AT, Cleves MA, Casey PH, Cradock MM, Anand KJ. Cognitive and behavioral outcomes of school-aged children who were born preterm: a meta-analysis. JAMA 2002 Aug;288(6):728-737.
- Hille ET, den Ouden AL, Bauer L, van den Oudenrijn C, Brand R, Verloove-Vanhorick SP; Collaborative Project on Preterm and Small for Gestational Age (POPS) Infants in The Netherlands. School performance at nine years of age in very premature and very low birth weight infants: perinatal risk factors and predictors at five years of age. J Pediatr 1994 Sep;125(3):426-434.
- Ornstein M, Ohlsson A, Edmonds J, Asztalos E. Neonatal follow-up of very low birthweight/extremely low birthweight infants to school age: a critical overview. Acta Paediatr Scand 1991 Aug-Sep;80(8-9):741-748.
- Institute of Medicine. Preventing Low Birthweight. Washington, DC: National Academy Press, 1985.
- Horbar JD, Lucey JF. Evaluation of neonatal intensive care technologies. Future Child 1995;5(1):139-161.
- World Health Organization (WHO). The World Health Report 2000: Health Systems—Improving Performance. Gerneva: World Health Organization, 2000.
- Al-Lamki L. UN Millennium Development Goals and Oman: Kudos to Oman on its 40th National Day. Sultan Qaboos Univ Med J 2010 Dec;10(3):301-305.
- Ministry of Health (MoH). Annual Health Report 2013. Muscat: Ministry of Health, Sultanate of Oman, 2014.
- Islam MM. Increasing Incidence of Infants with Low Birth Weight in Oman. Sultan Qaboos Univ Med J 2015 May;15(2):e177-e183.
- Al Riyami A, Elaty MA, Morsi M, Al Kharusi H, Al Shukaily W, Jaju S. Oman world health survey: part 1 - methodology, sociodemographic profile and epidemiology of non-communicable diseases in oman. Oman Med J 2012 Sep;27(5):425-443.
- Boerma JT, Weinstein KI, Rutstein SO, Sommerfelt AE. Data on birth weight in developing countries: can surveys help? Bull World Health Organ 1996;74(2):209-216.
- Eggleston E, Tsui AO, Fortney J. Assessing survey measures of infant birth weight and birth size in Ecuador. J Biosoc Sci 2000 Jul;32(3):373-382.
- Ministry of National Economy. (2003). Human development report in the Sultanate of Oman 2003. Ministry of National Economy, Oman. Available at http://www.moneoman.gov.om/book/hdr03/Final_en/en/ind_1.pdf. Accessed May 12, 2015.
- Al-Farsi YM, Waly MI, Al-Sharbati MM, Al-Shafaee M, Al-Farsi O, Al-Fahdi S, et al. Variation in socio-economic burden for caring of children with autism spectrum disorder in Oman: caregiver perspectives. J Autism Dev Disord 2013 May;43(5):1214-1221.
- Horwood LJ, Mogridge N, Darlow BA. Cognitive, educational, and behavioural outcomes at 7 to 8 years in a national very low birthweight cohort. Arch Dis Child Fetal Neonatal Ed 1998 Jul;79(1):F12-F20.
- Rickards AL, Kelly EA, Doyle LW, Callanan C. Cognition, academic progress, behavior and self-concept at 14 years of very low birth weight children. J Dev Behav Pediatr 2001 Feb;22(1):11-18.
- Klebanov PK, Brooks-Gunn J, McCormick MC. School achievement and failure in very low birth weight children. J Dev Behav Pediatr 1994 Aug;15(4):248-256.
- Danborno B, Vondun ZB, Timbuak JA, Danborno AM. Relationship between birth weight and school performance of children in Zaria, Nigeria. Annals of Biological Research 2014;5(10):21-25.
- Rodrigues MC, Mello RR, Fonseca SC. Learning difficulties in schoolchildren born with very low birth weight. J Pediatr (Rio J) 2006 Jan-Feb;82(1):6-14.
- Rickards AL, Kelly EA, Doyle LW, Callanan C. Cognition, academic progress, behavior and self-concept at 14 years of very low birth weight children. J Dev Behav Pediatr 2001 Feb;22(1):11-18.
- Breslau N, DelDotto JE, Brown GG, Kumar S, Ezhuthachan S, Hufnagle KG, et al. A gradient relationship between low birth weight and IQ at age 6 years. Arch Pediatr Adolesc Med 1994 Apr;148(4):377-383.
- Islam MM. Factors Influencing the Academic Performance of indergraduate Students in Sultan Qaboos University in Oman. Journal of Emerging Trends in Educational Research and Policy Studies 2014;5(4):396-404.
- Grissom JB, Shepard LA. Repeating and dropping out of school. In Flunking Grades: Research and Policies on Retention, ed. L.A. Shepards and M.L. Smith. Philadelphia: Falmer Press, 1989; Chapter 3: pp 34–63.
- Al-Sharbati MM, Al-Adawi S, Al-Lawativa S, Al-Hussaini A. School Failure: An exploratory observational study in Omani Schoolgirls. Journal of Behavioural Neuroscience Research 2005;3:29-39.
- Al-Ghanboosi SS, Ayedh AA. Student Dropout Trends at Sultan Qaboos University and Kuwait University: 2000-2011. Coll Stud J 2013;47:499-506.
- Bahgat G. Education in the Gulf Monarchies: Retrospect and Prospect. Int Rev Educ 1999;45:127-136.
- Shepard LA, Smith LM. Synthesis of research on grade retention. Educ Leadersh 1990;00:84-88.
- Currie J, Cole N. Does Participation in Transfer Programs During Pregnancy Improve Birth Weight? Working Paper No 3832., Cambridge, MA: National Bureau of Economic Research, Inc. 1991.