Sleep problems are very common, with a reported prevalence ranging from 19.2% to 57.5% among university students.1,2 Sleep disturbance is also widespread in the general population, and typically results from a number of conditions, which are either causal factors or correlates of sleep disruption. The most common of these conditions are narcolepsy, insomnia, hypersomnia, circadian rhythm disorder, delayed sleep phase syndrome, affective disorder, sleep apneas, sleep state misperception, daytime sleepiness, parasomnias, sleepwalking, nightmares, bruxism, and restless leg movement.3,4 Sleep problems and/or disorders have been associated with decreased attention, reduced cognitive performance, poor academic performance, fatigue, anxiety, stress, depression, drowsy driving, risk-taking behavior, impaired social relationships, altered sympathetic activity, increased risk of cardiovascular events, and overall poor health among adolescents and young adult males.3,4
Difficulty sleeping and its impact on overall health has led to the development of a number of diagnostic methodologies in sleep medicine. Foremost among these is polysomnography (PSG), which is currently regarded as the gold standard for sleep assessment and sleep disorder diagnosis.5,6 However, it has several drawbacks which have prevented its more widespread adoption by sleep medicine professionals. PSG is labor intensive, time-consuming, expensive, and requires highly trained personnel. More importantly, in many countries it is available in only a few centers.6,7 These considerations have stimulated interest in the development of a comprehensive standardized questionnaire, which could be used as an efficient and low-cost alternative to PSG. A major contribution to this effort has been the Pittsburgh Sleep Quality Index (PSQI). During the instrument’s development, both quantitative and subjective aspects of sleep, such as depth and comfort, were taken into consideration.8 The PSQI consists of seven components, each of which assesses a particular clinical aspect of sleep. The scores from each component are added to give a sum score, also called a global score (range 0 to 21). Combined, these numerical scores provide the clinician with an efficient overall summary of a patient’s quality of sleep and sleep health.
The PSQI has been used to examine sleep among various clinical, experimental, and normative samples.9 The psychometric and diagnostic properties have been evaluated in many sleep disorders, cultures, languages, and populations.10 There is now evidence that young adult male university students are particularly prone to sleep disorders.1,3,4 However, the validity and diagnostic applicability of the PSQI has not been established among this group nor among the young adult population in general. One exception to the overall lack of research in this area was the work of Aloba et al,11 who carried out a validation study of the PSQI in Nigerian university students and employed structured clinical interviews as the concurrent validation measure. However, to the best of our knowledge, no study has investigated the validity and diagnostic use of the PSQI among university students concomitant with the gold standard measure of PSG.
To address the need for a PSG validation of the PSQI among university students, we sought to carry out an investigation among this group, with a specific focus in an Indian sample, an underrepresented ethnic group in research efforts on the PSQI. Veqar et al,12 reported test-retest reliability of PSQI in university students with poor sleep. Our study aimed to extend these psychometric findings and to use PSG for examining the PSQI’s internal consistency, internal homogeneity, criterion validity, receiver operating characteristic (ROC) curve analysis, and other validation measures in young adult males.
Methods
Forty-seven male university students from Jamia Millia Islamia, New Delhi, India, were recruited between 2012–2013. No female subjects were recruited for the study. It has previously been reported that women are reluctant to participate in overnight polysomnographic studies, which are generally supervised by male technicians.13 The mean ±standard deviation (SD) age and body mass index (BMI) of the students was 23.4±3.9 years and 23.34±3.31kg/m2, respectively. Selection was made after a clinical interview to determine exclusion due to any serious cardiovascular, neurological, and psychiatric conditions, and other confounding medical conditions such as chronic pain, major recent injury, surgery, or emotional setbacks, and history of smoking, alcohol, and drug abuse. A detailed explanation regarding the purpose and procedures of the study was provided to the students and they gave informed consent in compliance with the requirements of the Helsinki Declaration.
The study was approved by the Human Institutional Ethics Committee of Jamia Millia Islamia. Since English was the medium of instruction at the university, all participating students had a communicable to proficient level of
English language.
All the participants underwent PSG sleep recordings for two consecutive nights, of which only the data from the second night were included in the study. The first night served as the adaptation night in the sleep laboratory environment. The RMS Quest 32 polysomnograph (Recorders and Medicare Systems, Chandigarh, India) was used to record sleep. The 2007 American Association of Sleep Medicine (AASM) manual was used for sleep scoring.14 The AASM standard recommendations for electroencephalography, electrooculography, chin electromyogram, electrocardiogram, limb movement, and blood oxygen saturation levels were used for sleep recording and evaluation. The sleep laboratory conditions were regulated as suggested in the literature.15 The original English version of the PSQI scale was used.
All volunteers were given general instructions for filling the PSQI by a simple demonstration and completed the forms at the time of the clinical interview. This was done to minimize validity problems from exaggeration and/or under-reporting of the severity and/or frequency of symptoms.16
The PSG recordings and PSQI data were analyzed to evaluate sleep and sleep characteristics. The sleep scoring of the PSG records was carried out by an experienced sleep researcher blinded to the PSQI score of the participants. A PSQI global score of ≥6 confirmed the presence of sleep disturbance. These scores were then used to evaluate the criterion and diagnostic validation of the PSQI.
The statistical package SPSS version 16.0 (SPSS Inc., Chicago, USA) was used to calculate descriptive and correlation statistics. The Cronbach alpha reliability test and correlation analysis between PSQI component and global scores were performed to calculate internal consistency and internal homogeneity. The PSQI component and global scores were correlated with the PSG measures of sleep onset latency (SOL), total sleep time (TST), total duration of wake after sleep onset (WASO1), number of episodes of wake after sleep onset (WASO2), and sleep efficiency (SE) for assessment of criterion validity. All correlations were computed using Spearman’s two-tailed test. The PSQI scores for sleep latency, sleep duration, sleep disturbance, daytime dysfunction, self-rated sleep quality, sleep efficiency, and medicine use will henceforth be referred to in this report as latency score, duration score, disturbance score, daytime dysfunction score, sleep quality score, sleep efficiency score, and medicine use score, respectively. MedCalc version 13.1.0 (MedCalc Soft., Acacialaan, Ostend) statistical software was used for ROC curve analysis. PSG served as the gold standard diagnostic test and the PSQI global score was the test variable. Sensitivity, specificity, Youden index J, area under the curve (AUC), likelihood ratio for a positive result (+LR), and likelihood ratio for a negative result (–LR) were calculated to validate the diagnostic accuracy of the PSQI scale.17 The percentage test accuracy (specificity + sensitivity/2), false-positive and false-negative rates (100-Specificity) were calculated manually.
Results
The median and interquartile range (IQR) of the PSQI component scores of sleep duration, sleep disturbance, sleep latency, daytime dysfunction, sleep efficiency, self-account of overall sleep quality and global scores were 1(0), 1(0), 1(1), 1(2), 0(1), 1(1) and 5(4), respectively.
Table 1 shows the frequency distribution of the PSQI components and the global score. Participant’s characteristics are given in Table 2.
Table 1: Pittsburgh Sleep Quality Index (PSQI) scores distribution in the study sample.
|
DURAT (hours) |
≥7 |
11 |
23.4 |
|
6–7 |
25 |
53.2 |
|
5–6 |
9 |
19.2 |
|
<5 |
2 |
4.3 |
|
DISTB |
0 |
3 |
6.4 |
|
1 |
35 |
74.5 |
|
2 |
9 |
19.2 |
|
3 |
0 |
0.0 |
|
LATEN |
0 |
7 |
14.9 |
|
1 |
19 |
40.4 |
|
2 |
11 |
23.4 |
|
3 |
10 |
21.9 |
|
DAYDYS |
0 |
13 |
27.7 |
|
1 |
20 |
42.6 |
|
2 |
10 |
21.3 |
|
3 |
4 |
8.5 |
|
HSE (%) |
>85 |
28 |
59.6 |
|
75–84 |
11 |
23.4 |
|
65–74 |
5 |
10.6 |
|
<65 |
2 |
4.3 |
|
SLPQUAL |
Very good |
7 |
14.9 |
|
Fairly good |
26 |
55.3 |
|
Fairly bad |
6 |
12.8 |
|
Very bad |
5 |
10.6 |
|
MEDS |
Not during the past month |
0 |
100.0 |
|
Less than once a week |
0 |
0.0 |
|
Once or twice a week |
0 |
0.0 |
|
Three or more times a week |
0 |
0.0 |
|
≥6 |
23 |
48.9 |
DURAT: Sleep duration; DISTB: Sleep disturbance; LATEN: Sleep latency; DAYDYS: Day dysfunction due to sleepiness; HSE: Sleep efficiency; SLPQUAL: Overall sleep quality; MEDS: Use of sleep medication.
MEDS are presented in ordinal scale of 0-3.
Table 2: Participant characteristics.
|
Age (years) |
23.43±3.90 |
|
Height (cm) |
167.70±4.20 |
|
Weight (kg) |
65.64±9.60 |
|
BMI (kg/m2) |
23.34±3.30 |
|
Marital status |
|
|
Married |
3 |
|
Unmarried |
44 |
|
Discipline |
|
|
Sciences |
6 |
|
Social science |
12 |
|
Engineering and technology |
7 |
|
Allied health sciences |
11 |
|
Languages |
5 |
|
Mass-communication |
1 |
|
Management |
3 |
|
Other |
2 |
|
Level of education |
|
|
Undergraduate |
28 |
|
First year |
6 |
|
Second year |
8 |
|
Third year |
9 |
|
Fourth year |
5 |
|
Post-graduate |
9 |
|
First year |
6 |
|
Second year |
3 |
|
MPhil |
7 |
|
First year |
3 |
|
Second year |
4 |
|
PhD |
3 |
|
Smoking habit |
5 |
|
Socio-economic status |
|
|
Lower class |
6 |
|
Middle class |
38 |
BMI: Body mass index.
The internal consistency test of PSQI scores showed an overall reliability coefficient (Cronbach’s alpha) of 0.736, a value suggesting acceptable consistency. The internal homogeneity test of correlation between the PSQI component scores and the global score showed significant and moderate to strong results [Table 3]. The majority of correlations between the component scores and the global score were significant (p<0.010). Significant correlations were found between the two scores when these were assessed for poor sleepers (PS) and normal sleepers (NS) either as separate groups or when analyzed as a combined group. The highest significant correlation coefficient was for the PSQI global score with the self-rated sleep quality score (r=0.797, p<0.010) and the least for global score with the duration score in the combined group (r=0.328, p<0.050). The intra-component correlations also had many significant pairs with latency score-sleep quality score showing highest correlation (r=0.645, p<0.010) and latency score-daytime dysfunction score (r=0.291, p<0.050) the least correlation. Only the duration and disturbance scores in the NS group had no significant correlation with the global score; however, even for these PSQI components, the PS and combined group showed a significant correlation.
The medicine use score was irrelevant in both tests because none of the participants reported drug use for sleep related issues. Therefore, the correlation matrix does not mention it [Table 3]. The global score and all PSQI components, excluding duration and medicine use score, were significantly higher in poor sleepers [Table 4]. These findings support the conclusion that the PSQI differentiated poor sleepers from normal sleepers and that the questionnaire items were internally consistent.
Table 3: Correlation among Pittsburgh Sleep Quality Index (PSQI) component and global scores.
|
DURAT combined (n=47) |
|
0.04 |
-0.11 |
0.25 |
0.20 |
0.10 |
0.33* |
|
NS (n=27) |
|
-0.14 |
-0.41* |
0.18 |
0.13 |
0.00 |
0.20 |
|
PS (n=20) |
|
0.21 |
0.10 |
0.29 |
0.28 |
0.17 |
0.50* |
|
DISTB combined (n=47) |
|
|
0.40** |
0.45** |
0.41** |
0.60** |
0.59** |
|
NS (n=27) |
|
|
-0.04 |
0.24 |
0.11 |
0.26 |
0.29 |
|
PS (n=20) |
|
|
0.62** |
0.52* |
0.46* |
0.70** |
0.77** |
|
LATEN combined (n=47) |
|
|
|
0.29* |
0.56** |
0.65** |
0.73** |
|
NS (n=27) |
|
|
|
-0.14 |
0.45* |
0.11 |
0.44* |
|
PS (n=20) |
|
|
|
0.37 |
0.54* |
0.93** |
0.82** |
|
DAYDYS combined (n=47) |
|
|
|
|
0.32* |
0.48** |
0.66** |
|
NS (n=27) |
|
|
|
|
0.04 |
0.30 |
0.53** |
|
PS (n=20) |
|
|
|
|
0.35 |
0.33 |
0.65** |
|
HSE combined (n=47) |
|
|
|
|
|
0.41** |
0.71** |
|
NS (n=27) |
|
|
|
|
|
0.11 |
0.62** |
|
PS (n=20) |
|
|
|
|
|
0.47* |
0.74** |
|
SLPQUAL combined (n=47) |
|
|
|
|
|
|
0.80** |
|
NS (n=27) |
|
|
|
|
|
|
0.59** |
*p<0.050 and **p<0.010; NS: Normal sleeper, PS: Poor sleeper, DURAT: Sleep duration; DISTB: Sleep disturbance; LATEN: Sleep latency; DAYDYS: Day dysfunction due to sleepiness; HSE: Sleep efficiency; SLPQUAL: Overall sleep quality. TOTAL represents PSQI component scores of sleep duration disturbance, latency, efficiency, self-reported overall quality and global score, respectively.
Table 4: Comparison of Pittsburgh Sleep Quality Index (PSQI) components between normal (NS) and poor sleepers (PS).
|
DURAT |
23.8 |
24.3 |
265.0 |
0.906 |
|
DISTB |
20.5 |
28.7 |
176.0 |
0.008 |
|
LATEN |
17.9 |
32.2 |
105.5 |
<0.001 |
|
DAYDYS |
19.3 |
30.4 |
142.0 |
0.004 |
|
HSE |
20.9 |
28.2 |
185.5 |
0.038 |
|
SLPQUAL |
17.4 |
32.9 |
92.0 |
<0.001 |
*Mean±SD; DURAT: Sleep duration; DISTB: Sleep disturbance; LATEN: Sleep latency; DAYDYS: Day dysfunction due to sleepiness; HSE: Sleep efficiency; SLPQUAL: Overall sleep quality; PSQI global: Pittsburgh sleep quality index global score; Independent t-test applied for PSQI global score and Mann Whitney U test applied for component score.
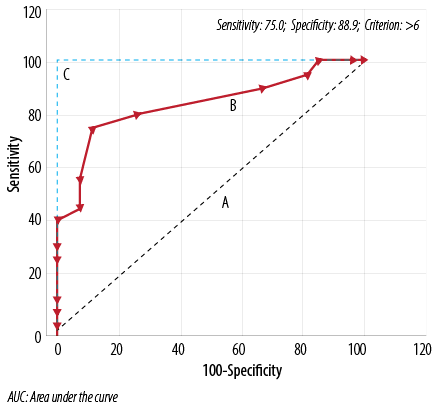
Figure 1:Receiver operator curves (A) line of zero discrimination (AUC=0.5) (B) Experimental test (AUC=0.834) and (C) Perfect test (AUC=1.0).
PSQI component and global scores were correlated with their corroborative PSG measures [Table 5]. Very few of the correlations between the global PSQI score and PSG measures were significant. Analysis of correlations was performed for the two groups when combined, as well as for the NS and PS groups separately. Only the PSG measures of SOL and total report time (TRT) among the PS group showed moderately strong, negative and significant correlations at p<0.050 with the global PSQI score. Correlations between PSQI component score and PSG measures SOL, WASO1, WASO2, TST, TRT, and SE showed some better correlations. The PSQI score for sleep duration showed a significant negative correlation with the relatively similar polysomnographic representations of TRT and TST in the NS and PS groups when measured separately and when combined. The PSQI score for sleep disturbance had a significant negative and moderately strong correlation with SOL in the PS group. The PSQI sleep latency score showed significant correlations with TST (negative and moderately strong) and TRT (moderately strong) in the NS group, while the PSQI sleep latency score had a negatively and moderately strong correlation with the PSG sleep onset latency score in the PS group. The PSQI scores for daytime dysfunction and sleep efficiency did not show any correlation. The sleep quality score among PS showed a significant negative and moderately strong correlation with SOL (p<0.010).
Table 5: Correlation of Pittsburgh Sleep Quality Index (PSQI) component scores and related polysomnography (PSG) sleep parameters.
|
DURAT |
Combined (n=47) |
-0.11 |
-0.162 |
-0.248 |
-0.537** |
-0.617** |
0.083 |
|
NS (n=27) |
-0.03 |
0.172 |
0.176 |
-0.547** |
-0.539** |
-0.110 |
|
PS (n=20) |
-0.25 |
-0.520* |
-0.582** |
-0.532* |
-0.709** |
0.294 |
|
DISTB |
Combined (n=47) |
-0.15 |
0.307* |
0.307* |
-0.193 |
-0.197 |
-0.307* |
|
NS (n=27) |
0.05 |
0.227 |
0.338 |
-0.003 |
0.024 |
-0.354 |
|
PS (n=20) |
-0.55* |
-0.073 |
-0.064 |
-0.309 |
-0.391 |
0.218 |
|
LATEN |
Combined (n=47) |
0.00 |
0.30* |
0.18 |
0.16 |
0.187 |
-0.267 |
|
NS (n=27) |
0.12 |
0.05 |
-0.12 |
0.47* |
0.516** |
-0.035 |
|
PS (n=20) |
-0.48* |
0.01 |
0.03 |
0.11 |
-0.037 |
0.300 |
|
DAYDYS |
Combined (n=47) |
0.21 |
-0.02 |
0.06 |
-0.29* |
-0.302* |
-0.178 |
|
NS (n=27) |
0.30 |
-0.23 |
0.02 |
-0.16 |
-0.189 |
0.005 |
|
PS (n=20) |
-0.05 |
-0.32 |
-0.21 |
-0.42 |
-0.438 |
0.213 |
|
HSE |
Combined (n=47) |
-0.10 |
0.10 |
-0.08 |
-0.23 |
-0.247 |
-0.100 |
|
NS (n=27) |
-0.01 |
0.00 |
-0.07 |
-0.08 |
-0.106 |
0.101 |
|
PS (n=20) |
-0.36 |
-0.09 |
-0.29 |
-0.25 |
-0.393 |
0.149 |
|
SLPQUAL |
Combined (n=47) |
-0.09 |
0.22 |
0.16 |
-0.06 |
-0.053 |
-0.189 |
|
NS (n=27) |
-0.08 |
-0.18 |
-0.11 |
0.14 |
0.134 |
0.268 |
|
PS (n=20) |
-0.56** |
-0.09 |
-0.10 |
-0.01 |
-0.155 |
0.364 |
|
Combined (n=47) |
0.02 |
0.20 |
0.10 |
-0.20 |
-0.205 |
-0.255 |
|
NS (n=27) |
0.08 |
-0.07 |
-0.03 |
0.10 |
0.090 |
0.087 |
*p<0.050 and **p<0.010; NS: Normal sleeper, PS: Poor sleeper, SOL: sleep onset latency; WASO1: total duration of WASO; WASO2: total number of episodes of WASO; TRT: total report time; TST: total sleep time; SE: sleep efficiency; DURAT: Sleep duration; DISTB: Sleep disturbance; LATEN: Sleep latency;
DAYDYS: Day dysfunction due to sleepiness; HSE: Sleep efficiency; SLPQUAL: Overall sleep quality; TOTAL: Pittsburgh sleep quality index global score.
Table 6 and Table 7 show the results of the ROC curve analysis. The ROC curve is shown in Figure 1. The analysis showed that a PSQI global score >6 was the optimal cut-off point for the diagnostic categorization of the population in NS and PS. Sensitivity, specificity, +LR and -LR for all the global scores (1–15) reported by the participants of the study sample were calculated. The values of sensitivity, specificity, +LR, –LR at the cut-off score were 75.0, 88.9, 6.75, and 0.28, respectively. Table 7 shows AUC, Youden index J, test accuracy, and the false-positive and false-negative rates at the experimental cut-off score.
Table 6: Diagnostic characteristics of Pittsburgh Sleep Quality Index (PSQI) scale at cut-off score of >6.
|
Youden index J |
0.64 (0.40–0.84) |
|
Area under curve |
0.84 (0.70–0.93; p<0.0001) |
|
Test accuracy |
81.9% |
|
False positive rate |
11.1% |
Table 7: Sensitivity, specificity, and likelihood ratio of the Pittsburgh Sleep Quality Index (PSQI) at each cut-off score.
|
≥1 |
100.0 |
0.0 |
1.00 |
|
|
>1 |
100.0 |
3.7 |
1.04 |
0.00 |
|
>2 |
100.0 |
14.8 |
1.17 |
0.00 |
|
>3 |
95.0 |
18.5 |
1.17 |
0.27 |
|
>4 |
90.0 |
33.3 |
1.35 |
0.30 |
|
>5 |
80.0 |
74.1 |
3.09 |
0.27 |
|
>6 |
75.0 |
88.9 |
6.75 |
0.28 |
|
>7 |
55.0 |
92.6 |
7.43 |
0.49 |
|
>9 |
45.0 |
92.6 |
6.08 |
0.59 |
|
>10 |
40.0 |
100.0 |
|
0.60 |
|
>11 |
30.0 |
100.0 |
|
0.70 |
|
>12 |
25.0 |
100.0 |
|
0.75 |
|
>13 |
10.0 |
100.0 |
|
0.90 |
|
>14 |
5.0 |
100.0 |
|
0.95 |
|
>15 |
0.0 |
100.0 |
|
1.00 |
+LR: likelihood ratio for a positive result; -LR: likelihood ratio for a negative result
Discussion
To the best of our knowledge, this is the first study to examine the PSQI psychometric and diagnostic validity with respect to PSG in young adult male university students. It is also the first report of PSQI validity in any segment of the Indian population using PSG sleep evaluation.
India is a diverse country with hundreds of languages; it thus offers to the researcher a unique and challenging opportunity for evaluating a questionnaire instrument. The usual approach of translating the scale into the local language may not be easy in the Indian population. We had the advantage of investigating a sample of fluent English speakers. English is the common language facilitating communication among Indians from different regions.
The study assessed the PSQI’s internal consistency and homogeneity, criterion validity and ROC curve analysis, and other measures of diagnostic validity. Nearly equal numbers of PS and NS, based on global score of ≥6, were recruited.8 This was done as per the prevalence report in the population.2 Earlier works have shown that the Korean version of the PSQI is a valid and reliable tool in distinguishing poor and good sleepers.18
The overall reliability coefficient (Cronbach’s alpha of 0.736 indicated that the PSQI had acceptable consistency. The experimental value of Cronbach’s alpha is higher than that reported in Arab (0.650)19 and Israeli samples (0.720)20, and less than that reported in the Iranian population (0.770)10 and the PSQI scale presenting paper by Buysse et al (0.830).8 The medicine use score irrelevance and duration score contributed negatively to the Cronbach’s alpha value. This was evident in an increased Cronbach’s alpha value of 0.757 if the medicine use score was deleted. Similarly, deletion of the PSQI sleep duration score (to assess its effect) increased the Cronbach’s alpha value to 0.767. This duration score effect also showed up in largely non-significant and weak correlation of the item with other components in the internal homogeneity test. Moreover, this was the only item that did not show significant differences between NS and PS. This is an interesting finding and contributes to the continuing debate about the validity of subjective accounts of sleep duration.21 The internal homogeneity was significant and correlation, r values, were strong (r>0.7) as evaluated by correlation analysis between global and component PSQI scores.
None of the included subjects reported use of any sleep medicine. This may be an important population specific finding because it is consistent with our experience of the rare reporting of sedative use in the Indian population for sleep related problems. It was recently reported that medicine score had the least contribution in assessing sleep problem in Indian students.2 The phenomenon of medication use was not explored further in our study. This observation suggests that a difference in sleep experience may exist between the North American population used in earlier validation studies of the PSQI8 and our South Asian sample. However, the relevance of this speculation would need to be investigated in a comparative cross-cultural study. The significantly higher values of global and PSQI component scores (except duration) among poor sleepers further validate the diagnostic discriminative ability of the scale.
The PSG and PSQI component and global scores have almost uniformly been shown to be very poorly correlated.8,18,22 Our study also found poor correlations between the sleep factors studied by the two methods. The main reason for the non-comparability of the findings is most likely attributable to differences in the construct design; the PSQI summarizes the previous month’s sleep while PSG only measures one specific night of sleep.8 This important difference may have affected the findings of the present study. The criterion validity is the extent to which the measures are demonstrably related to each other. The criterion validity test of correlating global score with PSG measures showed that only SOL and TRT among the PS group had significant negative correlations with the global score. However, PSG sleep measures and PSQI component scores showed better correlations. The sleep duration score and PSG corroborative measure of TRT and TST had significantly moderate-strong, but negative correlations in all three groups. This may suggest a uniform trend of over-reporting of sleep duration in the entire sample population. This finding is similar to that of an epidemiological study that looked at subjective and objective sleep duration.21 They found that there was significant positive correlation between PSG WASO1, WASO2 with the sleep disturbance score. PSG SE showed a significant negative correlation with the disturbance score. This finding may suggest that the subjective account of sleep disturbance is very close to similar objective sleep measurements. This may be an important finding if verified by further investigations. It would suggest that subjective accounts of sleep disturbance are less affected by biases of over and/or under reporting compared to other indices of subjective sleep parameters.
A significant correlation of latency score with WASO1 in the combined group was found. This seems to indicate that sleep onset and sleep maintenance problems were usually present in the same individuals in the study sample. Polysomnographic TRT and TST showed significant negative correlations with the daytime dysfunction score. TRT and TST are reflective of the sleep duration while the daytime dysfunction score gives an account of daytime sleepiness. Liu et al,23 reported a significant relationship between short sleep duration and daytime dysfunction among Japanese Asians. The significant and moderately strong negative correlation (r=-0.563, p<0.010) of the sleep quality score with SOL in PS suggested that sleep latency may be an important determinant of subjective sleep quality among Indian male students with sleep problems.
The cumulative history of PSQI validation studies has shown that the instrument has substantial reliability and validity for measuring sleep problems in young adult males. However, this body of evidence has shown that a key measurement issue, especially for establishing the PSQI’s validity, is how to determine the best cut-off point for differentiating NS from PS. A widely accepted approach is to maximize the sum of sensitivity and specificity (test accuracy), which is equivalent to maximization of Youden’s statistic (J=sensitivity + specificity – 1).24
In our study, this analysis showed that a global score of >6 was the optimal cut-off point for distinguishing NS and PS in this segment of the Indian population. The cut-off score is slightly greater than that published in the presenting paper of the PSQI scale (global score >5). This again may be due to the zero sensitivity of the medicine use score in the study. Moreover, different recommendations for cut-off scores have been reported previously.8,18,22,25,26 Backhaus et al,22 concluded that a global score cut-off of 6 was better in distinguishing primary insomniacs from healthy controls in the German population. The AUC value at the experimental cut-off was 0.83 (CI 0.70–0.93; p<0.0001), which is in moderate-high accuracy range.27 Curcio et al,25 reported an AUC value of 0.70 and an optimal global cut-off score of 5. Our study shows moderately higher range of sensitivity and specificity (75.0% and 88.9%, respectively). Our numeric figures of two indices are lower than those reported by the PSQI presenting paper and some other reports.8,18,22 Nevertheless, it is higher than that reported by Aloba et al,11 among a Nigerian university student population with 72.0% sensitivity and 54.5% specificity.
Likelihood ratios showed that the PSQI had adequate performance in sleep problem diagnosis in the study population. These ratios are less likely to be affected by population specific prevalence differences of the disorder than sensitivity and specificity. The experimental LR+ value of 6.75 (at cut-off score) meant that the PSQI scale had a moderately high efficiency as a diagnostic test.28 The false negative rate (25%) was slightly higher than previously reported in dementia patients (21%) at a memory clinic.29
Conclusion
The PSQI scale in its original, English form was found to be efficient in diagnosing sleep disturbances among young adult male Indian University students. The task of validating the PSQI was made easier by the linguistic characteristics of Indian society, and, for the same reason, we believe that the present findings have broad generalizability to the Indian population, and thus support the PSQI’s applicability in this population. As the earlier studies have shown, the cut-off score is sensitive to culture and population8,18,22,25,26 and we recommend that a cut-off score of >6 be used in the Indian population. However, the absence of any medicine use and the exclusively male sample highlight the need to build on this preliminary study. The range of the PSQI global was 1–15 in our study sample, which is less than the maximum possible range of 0–21. So, the non-representation of the extremely sleep disturbed group is a limitation. However, this aversion to medicine use may also indicate a general cultural reluctance to accept pharmaceutical interventions. In this prospective study, the sample size was a limitation and future validation studies on the Indian population with larger sample size are needed. It may still be an important finding given the poor status of awareness about sleep research and sleep health issues in the country at present.30 The results were generally supportive of the PSQI’s validity and utility for evaluating sleep problems in Indians, and thus represent a foundation for further studies in this area.
Disclosure
The authors declared no conflict of interests. This study was supported by a grant from the Indian Council of Medical Research (ICMR) grant- No.3/1/JRF-2007/MPD and University Grants Commission (UGC) grant-F.No.37-222/2009 (SR-). The sponsors of the study had no role in study design, data analysis, data interpretation, or writing of the report.
Acknowledgements
We are extremely grateful to the study participants who took time from their busy schedules to participate in the study. Permission was obtained from Dr. Buysse for the use of the PSQI in the present study.
references
- Cheng SH, Shih CC, Lee IH, Hou YW, Chen KC, Chen KT, et al. A study on the sleep quality of incoming university students. Psychiatry Res 2012 May;197(3):270-274.
- Manzar MD, Zannat W, Kaur M, Hussain ME. Sleep in university students across years of university education and gender influences. Int J Adolesc Med Health. 2014 Dec 3 [Epub ahead of print].
- Gaultney JF. The prevalence of sleep disorders in college students: impact on academic performance. J Am Coll Health 2010;59(2):91-97.
- Sweileh WM, Ali IA, Sawalha AF, Abu-Taha AS, Zyoud SH, Al-Jabi SW. Sleep habits and sleep problems among Palestinian students. Child Adolesc Psychiatry Ment Health 2011 Jul;5(1):25.
- Gregory AM, Cousins JC, Forbes EE, Trubnick L, Ryan ND, Axelson DA, et al. Sleep items in the child behavior checklist: a comparison with sleep diaries, actigraphy, and polysomnography. J Am Acad Child Adolesc Psychiatry 2011 May;50(5):499-507.
- Srijithesh PR, Shukla G, Srivastav A, Goyal V, Singh S, Behari M. Validity of the Berlin Questionnaire in identifying obstructive sleep apnea syndrome when administered to the informants of stroke patients. J Clin Neurosci 2011 Mar;18(3):340-343.
- Tripathi M. Technical notes for digital polysomnography recording in sleep medicine practice. Ann Indian Acad Neurol 2008 Apr;11(2):129-138.
- Buysse DJ, Reynolds CF III, Monk TH, Berman SR, Kupfer DJ. The Pittsburgh Sleep Quality Index: a new instrument for psychiatric practice and research. Psychiatry Res 1989 May;28(2):193-213.
- Grandner MA, Kripke DF, Yoon IY, Youngstedt SD. Criterion validity of the Pittsburgh Sleep Quality Index: Investigation in a non-clinical sample. Sleep Biol Rhythms 2006 Jun;4(2):129-139.
- Farrahi Moghaddam J, Nakhaee N, Sheibani V, Garrusi B, Amirkafi A. Reliability and validity of the Persian version of the Pittsburgh Sleep Quality Index (PSQI-P). Sleep Breath 2012 Mar;16(1):79-82.
- Aloba OO, Adewuya AO, Ola BA, Mapayi BM. Validity of the Pittsburgh Sleep Quality Index (PSQI) among Nigerian university students. Sleep Med 2007 Apr;8(3):266-270.
- Veqar Z, Moiz JA, Hussain ME. Psychometric analysis of the Pittsburgh insomnia rating scale among university population of poor sleepers in India. N Am J Med Sci 2014 Apr;6(4):161-167.
- Udwadia ZF, Doshi AV, Lonkar SG, Singh CI. Prevalence of sleep-disordered breathing and sleep apnea in middle-aged urban Indian men. Am J Respir Crit Care Med 2004 Jan;169(2):168-173.
- Iber C, Ancoli-Israel S, Chesson A, Quan SF; American Academy of Sleep Medicine. The AASM manual for the scoring of sleep and associated events: rules, terminology and technical specifications. 1st ed. Illinois: Westchester; 2007.
- Manzar MD, Sethi M, Hussain ME. Humidity and sleep: a review on thermal aspect. Biol Rhythm Res 2012;43:439-457.
- Bound J, Brown C, Mathiowetz N. Measurement error in survey data. In: Heckman JJ and Edward Leamer (eds) Handbook of Econometrics 5thed. Elsevier: Amsterdam; 2001. p. 3705-3843.
- DeLong ER, DeLong DM, Clarke-Pearson DL. Comparing the areas under two or more correlated receiver operating characteristic curves: a nonparametric approach. Biometrics 1988 Sep;44(3):837-845.
- Sohn SI, Kim H, Lee MY, Cho YW. The reliability and validity of the Korean version of the Pittsburgh Sleep Quality Index. Sleep Breath 2012 Sep;16(3):803-812.
- Suleiman KH, Yates BC, Berger AM, Pozehl B, Meza J. Translating the Pittsburgh Sleep Quality Index into Arabic. West J Nurs Res 2010 Mar;32(2):250-268.
- Shochat T, Tzischinsky O, Oksenberg A, Peled R. Validation of the Pittsburgh Sleep Quality Index Hebrew translation (PSQI-H) in a sleep clinic sample. Isr Med Assoc J 2007 Dec;9(12):853-856.
- Lauderdale DS, Knutson KL, Yan LL, Liu K, Rathouz PJ. Self-reported and measured sleep duration: how similar are they? Epidemiology 2008 Nov;19(6):838-845.
- Backhaus J, Junghanns K, Broocks A, Riemann D, Hohagen F. Test-retest reliability and validity of the Pittsburgh Sleep Quality Index in primary insomnia. J Psychosom Res 2002 Sep;53(3):737-740.
- Liu X, Uchiyama M, Kim K, Okawa M, Shibui K, Kudo Y, et al. Sleep loss and daytime sleepiness in the general adult population of Japan. Psychiatry Res 2000 Feb;93(1):1-11.
- Youden WJ. Index for rating diagnostic tests. Cancer 1950 Jan;3(1):32-35.
- Curcio G, Tempesta D, Scarlata S, Marzano C, Moroni F, Rossini PM, et al. Validity of the Italian version of the Pittsburgh Sleep Quality Index (PSQI). Neurol Sci 2013 Apr;34(4):511-519.
- Okajima I, Komada Y, Nomura T, Nakashima K, Inoue Y. Insomnia as a risk for depression: a longitudinal epidemiologic study on a Japanese rural cohort. J Clin Psychiatry 2012 Mar;73(3):377-383.
- Fischer JE, Bachmann LM, Jaeschke R. A readers’ guide to the interpretation of diagnostic test properties: clinical example of sepsis. Intensive Care Med 2003 Jul;29(7):1043-1051.
- Flemons WW, Whitelaw WA, Brant R, Remmers JE. Likelihood ratios for a sleep apnea clinical prediction rule. Am J Respir Crit Care Med 1994 Nov;150(5 Pt 1):1279-1285.
- Hancock P, Larner AJ. Diagnostic utility of the Pittsburgh Sleep Quality Index in memory clinics. Int J Geriatr Psychiatry 2009 Nov;24(11):1237-1241.
- Manzar MD, Hussain ME. Lack of awareness and apathy to sleep health issues. IJSC. 2014 Jun;13(1):7-10.