|
INTRODUCTION
Hyperinsulinemia is considered indicative of insulin resistance. Biological actions of insulin are essential for regulation and maintenance of glucose homeostasis. Insulin resistance (IR) is defined as decreased sensitivity or responsiveness to the metabolic actions of insulin. It plays an important role in the pathophysiology of diabetes, and it has shown to be a future predictor of many health related adverse outcomes including coronary artery disease and stroke.1,2,3
Insulin resistance is also associated with obesity as well as hypertension, coronary artery disease, and dyslipidemias.4 Moreover, IR is a feature of a number of syndromes related to abnormal reproductive endocrinology, such as polycystic ovarian syndrome and premature adrenarche.5 Therefore, it is of great interest to quantify insulin sensitivity and resistance in humans to investigate the pathophysiology and epidemiology of major public health problems and to follow the clinical course of patients on various therapeutic regimens.
There are many ways to measure insulin resistance, for example; Homeostasis Model Assessment for Insulin resistance (HOMA-IR) and Quantitative Insulin-Sensitivity Check Index (QUICKI), hyperinsulinemic euglycemic clamp tests and insulin suppression tests.6
The exact relationship between leptin and insulin is not clear and is sometimes controversial. Although insulin is secreted from the pancreatic beta cells rather than from adipocytes, the secretion of both hormones is influenced by overall amount of fat stores as well as by short-term changes in energy balance. Also, insulin receptors are located in the same key hypothalamic areas as leptin receptors. Insulin secretion is stimulated acutely in response to meals, whereas leptin secretion is not.7
Leptin is a peptide hormone encoded by the obesity gene. It is a 16-kDa protein produced primarily in adipose tissue. It plays an important role in regulating food intake, reproduction, and immune function.8 Also, it plays a range of roles as a growth factor in a number of different cell types, such as a mediator of energy expenditure and most importantly, it interacts with other hormonal mediators and regulators of energy and metabolism such as insulin, glucagon, growth hormone and glucocorticoids.9
Strong evidence indicates that leptin along with insulin exerts an inhibitory effect on food intake, and an activation effect on the regulation of thermogenesis within the central nervous system.10 Leptin and insulin produce a critical signal which helps the brain in the long-term regulation of energy homeostasis.11 Recently, a number of studies have suggested that the fasting glucose to insulin ratio (G/I) may represent another useful method for assessing insulin resistance.12 However, unlike HOMA or QUICKI, which are based on the product of fasting insulin and glucose, G/I does not appropriately reflect the physiology underlying the determinants of insulin sensitivity.13
The potential problems with using the fasting G/I ratio as a physiologically appropriate index of insulin sensitivity become apparent when fasting glucose levels are abnormal.13 When a normal subject is compared with a non-diabetic insulin-resistant subject (whose fasting insulin level is elevated), simple indices of insulin sensitivity based on fasting values such as leptin/insulin, QUICKI, and G/I are all decreased in the insulin-resistant subject when compared with the normal subject. Likewise, HOMA, an index of insulin resistance, increases as expected. A diabetic subject who has the same fasting insulin level as the non-diabetic insulin-resistant subject is obviously even more insulin resistant because the same level of insulinemia does not appropriately compensate for fasting hyperglycemia. Importantly, in this diabetic subject, the value for QUICKI decreased even further and HOMA increased further, exactly as one might predict.14
However, 1/insulin remains unchanged between the diabetic subject and the non-diabetic insulin-resistant subject, and G/I paradoxically and erroneously increase in the diabetic subject. Thus, QUICKI and HOMA both behave qualitatively as expected across a broad spectrum of insulin sensitivity and resistance. By contrast, the G/I ratio and 1/insulin only behave appropriately in subjects with normal fasting glucose. Indeed, G/I is functionally equivalent to 1/insulin under these conditions, and there is no advantage of using G/I instead of 1/insulin.
This study aims to identify the fasting glucose/leptin ratio as a new simple method for the detection of IR in Iraqi diabetes mellitus patients, and examine its usefulness as a new marker other than G/I, QUICKI and HOMA indexes.
METHODS
A case control study was conducted at the National Diabetes Center, College of Medicine at Al-Mustansiryia University from 1 August 2008 to 30 January 2010. 61 patients (31 males and 30 females) with diabetes mellitus were included in this study. 63 healthy subjects (32 males and 31 females) were used as a control. A questionnaire was designed with different questions including diabetes type, its duration, family history, smoking, usage of drugs, drug duration, body mass index, and hypertension for both patients and control groups. All diabetic patients were examined by an endocrinologist to confirm the diagnosis. Patients with hypertension, myocardial infarction, thyroid function diseases, and hormonal abnormalities were excluded from the study.
10 ml of blood was collected from each patient and controls. They were asked to be fasting for at least 9 to 12 hours. Blood samples were left to clot for 10 minutes and then centrifuged for 15 minutes at 1500 x g, and the serum was collected.
Serum was used to evaluate fasting glucose, insulin and leptin. Glucose was determined by enzyme spectrophotometric method (Biomérieux kit) at 510 nm (normal reference range was 65-110 mg/dl). While serum leptin and insulin hormones were measured using High Performance Liquid Chromatography (HPLC), Shimadzu (Kyoto, Japan) which consisted of a system controller model SCL-10 AVP, a degasser model DGU-12A, two liquid delivery pumps model LC-8AVP, UV-Visible detector model SPD-10AVP, and an injector model SIL-10A, equipped with 20 µl sample loop. The HPLC system was interfaced with a computer via a Shimadzu class-VP5 chromatography data system program supplied by the manufacturer; Epson LQ-300 printer model P852A (Japan).
All samples and standard solutions were chromatographically analyzed with ODS column using gradient mobile phase 30% acetonitrile, 70% water, flow rate 1ml/min and UV-VIS detection at wavelength 233 nm in order to estimate serum leptin.15 For estimating serum insulin,16 samples were analyzed using C18 column, gradient mobile phase consisting of a mixture of 74% of 0.2 M Sodium Sulfate adjusted at pH 4.5 and 26 volume of acetonitrile, the flow rate was 1.2 ml/min at wavelength 214 nm. Normal reference ranges for both leptin and insulin were (6.6-11.0 ng/ml, 2-25 µIU/ml) respectively according to the American Medical Association.17
Glucose/insulin ratio was easily calculated, with lower values depicting higher degrees of insulin resistance (G/I ratio).18 Quantitative insulin sensitivity check index (QUICKI=1/[log I0 + log G0],) and Homeostatic model assessment (HOMA=I0 X G0 / 405) were calculated. Body mass Index was calculated by dividing subjects weight (Kg) by their height (m2).19
Data was entered into SPSS version 17. Descriptive statistics in terms of mean and Standard Deviation were calculated for the two groups. Pearson’s correlation as well as linear regression equation was calculated to estimate the slope (B) in order to determine the amount of change in dependent variables with per unit change in insulin resistance. A p-value of <0.05 was considered statistically significant. The sensitivity and specificity of the proposed diagnostic marker of leptin resistance (fasting glucose/leptin) ratio index was estimated.
RESULTS
61 diabetic patients, aged 39.27±7.37 years (mean ± SD) were included in this study. 31 out of the 61 were males (50.82%), mean age of 37.62±7.69 years and the rest were females (n=30, 49.18%) with mean age of 41.0±6.78 years. Approximately, more than half of the patients had Diabetes mellitus type I (n=39, 63.93%) and 22 (36.07%) had type II, the age of patients with type I and II was comparable as shown in Table 1. Patients were asked about the time of onset of diabetes, duration, family history, any other disease, hypertension, and drug usage. 63 healthy subjects, mean age 38.31±5.65 years with no diabetes mellitus or any other hormonal disturbances, hypertension, family history, usage of any medication were taken as a control. Out of the 63 patients, 32(50.79%) were males and 31(49.21%) were females. Mean age was 36.81±7.08 and 40.1±3.97 years respectively. In general, the age between patients and controls was comparable.
The patient’s duration of DM was divided into two groups, (Table 1). For being less or equal to 2 years, in general, 25 were included. Ten of them were males (40%) and 15 (60%) were females. While 17 (68%) out of the total 25 were with type I and eight (32%) were with type II DM. 36 patients had diabetes for a duration of more than 2 years. 21 (58.33%) out of them were males, and 15 (41.67%0) were females. While 27 (75%) had type I and 9 (25%) had type II DM.
Table 1: Descriptive analysis including mean standard deviation for both patient and control groups.Mean±Standard Deviation(SD)
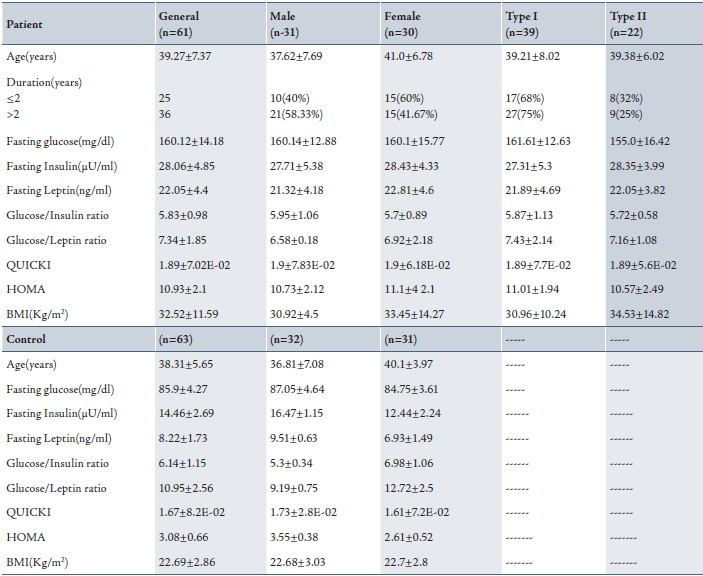
Biochemical test results showed that levels of fasting glucose, insulin and leptin were significantly higher in diabetic patients caompared with the control group (with normal references ranges).
In additionl, patients BMI's were more than 29 kg/m2 and so they were all obese. In females, BMI was higher than in males (33.45±14.27 and 30.92±4.5) kg/m2 respectively. while the controls’ BMI were lower than 25 Kg/m2, thus they were not obese. There was no significant difference between males and females in terms of BMI.
Levels of fasting insulin in diabetic patients were above 25 µU/ml, which is the upper limit of normal insulin reference range. All patients in this study were hyperinsulinemic. On the other hand, the patient’s serum fasting leptin was also elevated more than the normal range in both males and females. They were all hyperleptinemic. Regarding type I and II DM patients, both levels of fasting serum insulin and leptin were comparable. A significant difference was found between the levels of hormones and between patients and control.
QUICKI, and G/I are indices of insulin sensitivity and those values should decrease with increasing insulin resistance, while HOMA is an index of insulin resistance whose value should increase with increasing insulin resistance. In Table 1, G/I and QUICKI give values lower than HOMA with increasing insulin resistance (hyperinsulinemia). There was no significant difference between the given values among patients classified according to their sex and type of diabetes. In the control group, these results were the opposite. QUICKI and G/I ratios were higher and HOMA was lower than those found in the patient group. (Table 1)
A proposed new ratio was calculated in this study for both patient and control groups. The fasting glucose/leptin ratio (G/L) was used as another index for diabetic patients in addition to the G/I ratio. G/L ratio decreased with increasing leptin resistance despite sex and type of classification as shown in Table 1. This ratio was higher in the control group compared to the patient group.
In the patient group, a highly significant positive correlation was found between fasting leptin and fasting insulin, QUICKI, and HOMA (p<0.0001), while there was a significant positive correlation observed between BMI and fasting leptin, p<0.05. (Table 2)
Table 2: Correlation between fasting leptin, fasting insulin, BMI, QUICKI and HOMA indices among patients group.
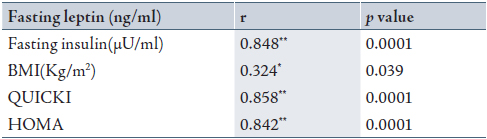
* Significant correlation when p<0.05; ** highly significant correlation when p<0.01 and r= correlation.
To evaluate the validity of G/L ratio compared to G/I ratio in addition to other indices used in diagnosis of DM, the probability ratio of a positive test was calculated to confirm the positive significant correlation found as mentioned in Table 3. The sensitivity of fasting G/L ratio was slightly higher than that of fasting G/I ratio (68.59 vs 67.69). The sensitivity and specificity of HOMA and QUICKI and their probability ratio of positive tests were found to have the same values. (Table 3)
Table 3: Validity of the diabetic diagnostic tests in patients group using ratio positive = sensitivity / (1 − specificity) equation.
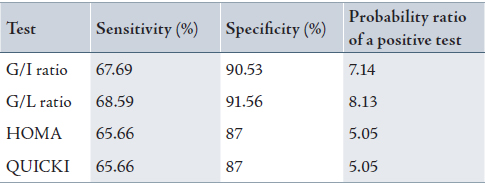
G/I ratio: fasting glucose/insulin ratio; G/L ratio: fasting glucose/leptin ratio; HOMA: Homeostatic model assessment; QUICKI: Quantitative insulin sensitivity check index.
Among the patient group, a highly significant correlation was found between (fasting insulin + fasting leptin) and between fasting glucose/insulin (G/I) and fasting glucose/leptin (G/L) ratios respectively with linear regression equations as shows in Figs. 1 and 2.
In addition, a highly significant negative correlation with linear regression equation was found between fasting insulin and both G/I and G/L ratios as shown in Figs. 3 and 4 respectively. All correlations were found among the patient group irrespective of sex and type of DM.
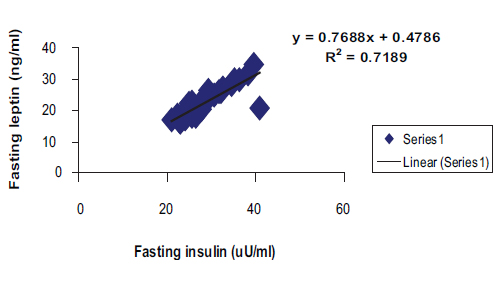
Figure 1: Positive correlation with linear regression equation between fasting serum insulin and fasting leptin among patients group in general. (R2=0.7189, r=0.848, p<0.0001, y= 0.7688x+0.4786).
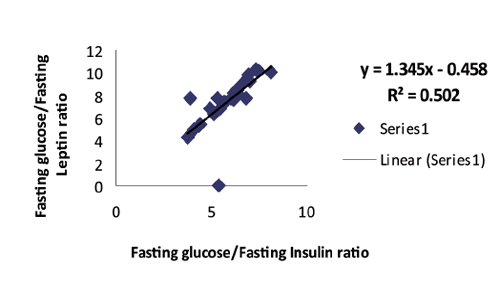
Figure 2: Positive correlation with linear regression equation between fasting glucose/insulin and fasting glucose/leptin ratios among patients group in general. (R2=0.502, r=0.709, p<0.0001, y=1.345x-0.458).
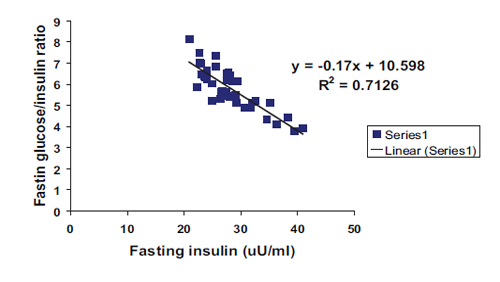
Figure 3: Negative correlation with linear regression equation between fasting insulin and fasting glucose/insulin ratio among patients group in general. (R2=0.7126, r=0.844, p<0.0001, y= -0.17x+10.598).
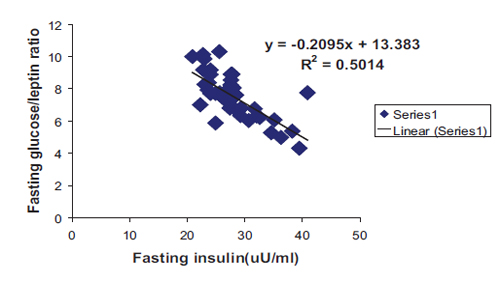
Figure 4: Negative correlation with linear regression equation between fasting insulin and fasting glucose/leptin ratio among patients group in general. (R2=0.5014, r=0.708, p<0.0001, y= -0.2095x+13.383).
DISCUSSION
Insulin resistance is a term, which has a broad clinical spectrum and heterogeneities in the manifestations. The degree of insulin resistance can also vary among different clinical states. The concept of insulin resistance is easy to understand but quantitative assessment of insulin sensitivity, which is the reverse of resistance, and the ability to determine exactly who is insulin resistant is more difficult in a clinical setting. However, this assessment of insulin resistance or insulin sensitivity is of great importance in the study of epidemiology and pathophysiology of major public health problems and in following the clinical course of patients on various therapeutic regimens. In addition to age and ethnicity, obesity is also considered as an important independent cause of insulin resistance.20 It can influence the phenotype of the syndrome and can worsen the endocrine and metabolic parameters.21
Katz et al. found that QUICKI may not be a reliable method to accurately include the wide spectrum of insulin sensitivity in different insulin-resistant populations.22 While Abassi and Reavan also found that QUICKI was less efficient in cases of mild insulin resistance.23
Hyperinsulinemia results from insulin resistance when the pancreas produces much more insulin than normal. Many problems including endocrine disorders with obesity and high leptin levels may be associated with IR.24 Wauters et al. showed that leptin is important in weight regulation and acts to control food intake and energy expenditure. They found that leptin concentrations increased with obesity and tend to decrease with weight loss and correlate with insulin levels in patients with hyperinsulinemia.25 Wauters et al. were consistent with our results as leptin concentration was found to be elevated in DM patients with BMI of >30 kg/m2. Whereas in normal healthy non-obese subjects, it was within the normal range.
Most studies are focused on predicting insulin sensitivity in normoglycemic individuals and have investigated predictors of insulin resistance. While McAuey et al. studied people with IGT and diabetes, rather than normoglycemic individuals in the general population.26 They found that fasting insulin alone was less variable and was highly correlated with International sensitivity index (ISI) in individuals with normoglycemia than in individuals with impaired glucose tolerance (IGT) and diabetes. Thus, any method to predict insulin sensitivity in normoglycemic individuals should first be compared with fasting insulin. In addition, they reported that a number of clinical and metabolic abnormalities have been associated with insulin resistance. The metabolic disorders classified included dyslipidemia, hypertension, and IGT. However, they did confirm that the best method was dependent on glucose status. They found that BMI, insulin at 120 min, and glucose at 90 min best predicted insulin sensitivity.26
Jifí et al. in 2002 suggested the suitability of the QUICKI index for diagnosis of insulin resistance in clinical and epidemiological practice. However, a normal QUICKI index range needs to be established for each laboratory with an appropriate control group because of significant interlaboratory variations in insulin determinations and/or possible differences in various populations.27 Maghbooli et al. in 2007 examined the association between plasma leptin concentrations and insulin resistance in patients with diabetes mellitus and found that elevated leptin concentrations were positively associated with insulin levels, BMI, and HOMA, similar to the results of this study, (Table 2). They concluded that leptin level ≥20 ng/ml could help to predict the development of diabetes mellitus. Measurement of leptin together with the assessment of other risk factors could help identify the development of DM.28
Philippe and Ludwik in 2002 reported that glucose clamp is generally regarded as the reference method for assessing insulin sensitivity in humans because it directly measures metabolic actions of insulin under steady state conditions. A number of studies have suggested that the G/I may represent another useful method for assessing insulin resistance.29 However, unlike HOMA or QUICKI, which are based on the product of fasting insulin and glucose, G/I does not appropriately reflect the physiology underlying the determinants of insulin sensitivity. The potential problems with using the fasting G/I ratio as a physiologically appropriate index of insulin sensitivity become apparent when fasting glucose levels are abnormal.13
The expression of leptin in adipocytes and its plasma concentration are both positively correlated with total adiposity. Therefore, it is generally believed that leptin represents a lipostatic factor contributing to the regulation of body weight via a negative feedback loop. In addition to total adiposity, plasma leptin concentrations can be acutely modulated by a variety of physiological conditions (starvation-refeeding and cold exposure) and hormonal factors (insulin, catecholamines, glucocorticoids, thyroid hormones, gonadal steroids, etc.). The observations that starvation decreases both plasma insulin and leptin levels and that obesity is strongly associated with hyperinsulinemia and hyperleptinemia have led many researchers to investigate the effects of insulin on leptin secretion. Although several studies found that insulin stimulates leptin expression and secretion in adipocytes in vitro, others found little or no effect of insulin. The in vivo effects of insulin on leptinemia are also contradictory; some groups reported that insulin increases plasma leptin levels in rodents or humans, whereas others found that insulin does not appear to acutely regulate leptin expression or secretion. Pelegrino et al. in 2006 reported that hyperglycemia, insulin resistance and hyperleptinemia are some of the consequences of obesity. The beneficial effects of bariatric surgery are already noticeable 1 month postoperatively, the reduction in insulin levels being more important for leptin reduction rather than decreased BMI. Leptin appeared to be subject to multifactorial control and showed a larger reduction than body weight.30
CONCLUSION
Because of a high correlation between insulin and leptin in patients with DM, and because of the potential problems with using the fasting G/I ratio as an index of insulin sensitivity, a new ratio between fasting glucose/leptin was proposed in this study to be used as an index for predicting DM when fasting glucose levels are abnormal. In conclusion, the G/L ratio can be used in addition to G/I ratio, QUICKI, and HOMA to accurately assess insulin resistance in subjects with hyperglycemia.
ACKNOWLEDGEMENTS
The authors reported no conflict of interest and no funding was received on this work.
|