Leptin is a key regulator of food intake and glucose homeostasis. Its circulatory level is affected by body fat composition and caloric intake.1,2 Higher serum levels of leptin are seen in subjects with obesity and overfeeding while lower levels are associated with energy deficiency.3,4 Levels of both leptin and ghrelin, regulator of energy balance, are routinely used to investigate conditions related to altered body weight, insulin resistance, and appetite.5
Clinically, leptin administration is used to treat patients with leptin dysfunction and leptin deficiencies,6,7 and measurement of leptin levels against a reference range is warranted to identify clinical cases. Despite similar environmental influences, serum levels of leptin vary between different ethnic groups due to racial differences in body weight distribution.8–10
Obesity trends in Middle Eastern Arab populations are alarming with an increasing concern in obesity-associated complications. The World Health Organization lists multiple Arab countries in the top 10 countries with the highest obesity prevalences.11 To the best of our knowledge, published reports of reference range of serum leptin levels in Arabs do not exist. Therefore, the main aim of this study was to determine normal reference range of serum leptin in the adult Arab population from Oman using the Clinical and Laboratory Standards Institute (CLSI) standard guideline to establish a reference range. We also aimed to identify a cut-off point for serum leptin for determination of different metabolic derangements.
Methods
In this cross-sectional study, data on 1198 subjects over the age of 18 were obtained from the Oman Family Study (OFS).12,13 This dataset size is higher than the CLSI recommended minimum sample size for reference range studies: 120 observations for 90% confidence, 153 for 95% confidence, and 198 for 99% confidence.14 We collected the following parameters: age, gender, waist circumference, percentage body fat, serum leptin, body mass index (BMI), hypertension, and metabolic syndrome. The OFS was ethically approved by the college Medical Research Committee for the use of data for analysis.15 Informed consent was obtained from all individuals included in this study.
Laboratory parameters obtained in OFS were done on fasting blood samples. Total body fat percentages were measured using an electrical impedance scale (Tanita, Japan). Serum leptin was obtained using an immune-radiometric assay (Diagnostic Systems, USA). The waist circumference was measured using the standard method of using a measuring tape around the middle just above the hipbone. BMI was calculated as weight (in kg) divided by the square of height (in meters). Obesity was defined as a BMI of 30 kg/m2 and above. Metabolic syndrome was defined using the International Diabetic Federation (IDF) definition.16 Using the IDF definition, hypertension was defined as blood pressure of 130/85 mmHg or higher.
To assess the normal distribution of serum leptin we used Kernel density, quartile-quartile (Q-Q) plots, and Shapiro-Wilk normality test. Skewed distribution was normalized by multiple transformation methods like logarithmic (base 10), cube root, square root, reciprocal, or square transformations. Further normalization was applied using the Lambert transformation, the Box-Cox transformation, the Yeo-Johnson transformation, and the Ordered Quantile technique. Following the reference range estimation, transformed values were returned to their geometric values. All transformation and statistic tests were performed using R statistical packages.17 Package ‘ggpubr’ was used to generate figures, and package ‘bestNormalize’ to apply normalization.14,18
To determine the reference range, we used the percentile method to determine the reference range with a lower limit determined at the 2.5th percentile and an upper limit at the 97.5th percentile.14 The receiver operating characteristic analysis was used to identify the cut-off point for multiple metabolic derangements: metabolic syndrome, obesity, and type 2 diabetes. The optimum cut-off was identified from the value with maximum sensitivity and specificity measured by Youden index (sensitivity+ specificity -100).
We also tested if there were any gender differences in leptin values by performing the Student’s t-test used on normalized data. The Mann-Whitney U was used on skewed distributed parameters. The correlation between age and leptin was tested by Pearson’s correlation test for the normal distributed transformed leptin values and Kendall correlation for non-transformed leptin values. Correlation presented in a scatter plot with Kendall and Pearson p-value and r and tau coefficients.
Results
Data were collected from a total of 1198 subjects (44.7% male and 55.3% female). Demographic characteristics of the study population are shown as median (interquartile range (IQR)) in Table 1. No differences were observed in BMI and waist circumference between males and females, but the percentages of body fats were significantly higher in females (28.6%, IQR = 14.1) than males (18.0%, IQR = 13.1), p-value < 0.001. Obesity and metabolic syndrome were more prevalent in female than male subjects. Hypertension was significantly higher in male subjects (p = 0.001).
Table 1: Demographic data of study subjects.
|
Number
|
1198
|
536 (44.7)
|
662 (55.3)
|
-
|
|
Age, years
|
28.0 (24.0)
|
27.0 (22.0)
|
30.0 (23.0)
|
0.005
|
|
Waist circumference, cm
|
80.0 (21.0)
|
80.00 (22.0)
|
80.00 (22.0)
|
0.723
|
|
Body mass index, kg/m2
|
24.61 (7.19)
|
24.50 (7.29)
|
24.68 (7.31)
|
0.350
|
|
Percentage body fat, %
|
23.3 (15.8)
|
18.0 (13.1)
|
28.6 (14.1)
|
< 0.001
|
|
Obesity, n (%)
|
205 (17.1)
|
82 (40.0)
|
123 (60.0)
|
0.134
|
|
Hypertension, n (%)
|
496 (41.4)
|
250 (50.4)
|
246 (49.6)
|
0.001
|
Data shown are median (interquartile range) for continuous variables and percentages for categorical data.
p-value of Mann Whitney-U and chi-square tests are shown.
Serum levels of leptin were not normally distributed [Figure 1a] with a median of 20.0 ng/mL and mean of 26.9 ng/mL. Both density and Q-Q plots show a skewed distribution with Shapiro-Wilk normality test p-value < 0.05 [Figure 1b]. We then applied multiple transformations, described in the method section, to normalize the distribution (data not shown). Only ordered quantile transformation resulted in a bell-shape distribution and non-deviated Q-Q plot with equal mean and median (transformed values) [Figure 1c and d].
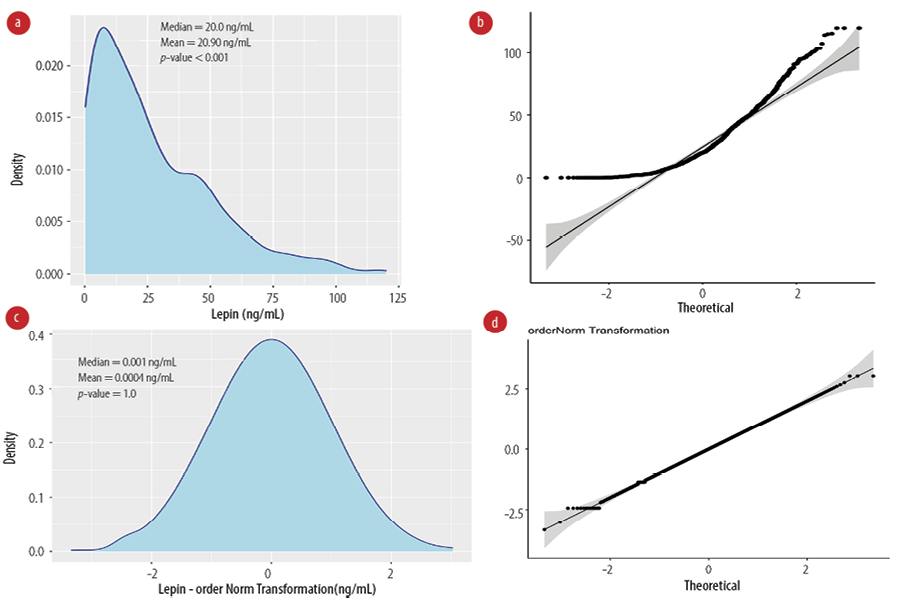 Figure 1: Normalization of serum leptin levels. (a) Kernel density and (b) quantile-quantile plots are shown for non-transformed leptin values, p-value: Shapiro-Wilk normality test. (c) Kernel density and (d) quantile-quantile plots show the ordered quantile transformation leptin values, Shapiro-Wilk p-value > 0.05 indicates normal distribution.
We generated a density plot to identify the reference range from middle 95th percentile values of leptin. The reference range of serum leptin was identified as 2.5th percentile = 0.5 ng/mL and 97.5th percentile = 90.6 ng/mL [Figure 2 a].
We further explored the gender differences in serum leptin levels. Mann-Whitney U test was used on non-transformed values, and it showed a significant difference between males (median = 8.8, IQR = 3.0–19.1 ng/mL) and females (median = 34.2, IQR = 19.1–51.6 ng/mL), p-value < 0.001 [Figure 2b]. We also used the Student t-test on normalized leptin values and the test showed a significant difference between males and females (male mean = -0.6±0.8 ng/mL, female mean = 0.5±0.8 ng/mL, p-value < 0.001) [Figure 2c]. We then identified the reference range for males 0.25–48.8 ng/mL and females 4.9–96.3 ng/mL according to the 95% percentile region.
We did not observe a correlation between age and leptin shown by weak correlation coefficient values of 0.17 and 0.093 of Pearson and Kendall correlation tests, respectively [Figure 2d]. As age was not strongly correlated with leptin, we did not perform age-dependent reference ranges for leptin.
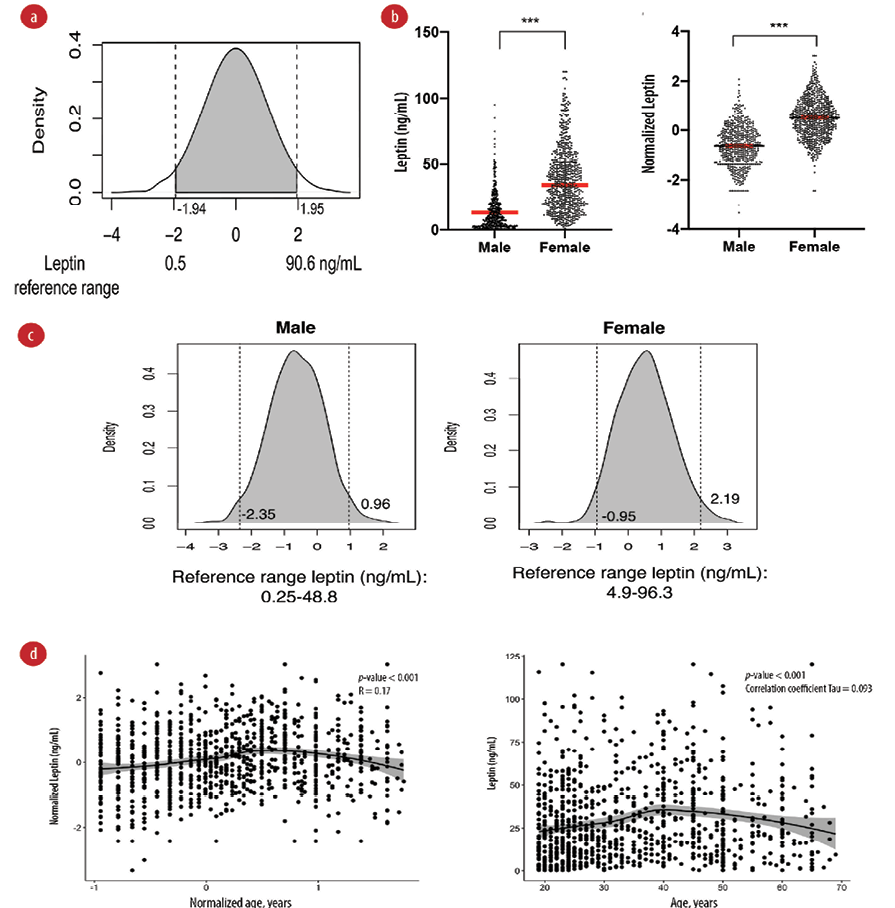 Figure 2: Reference range for serum leptin. (a) Leptin reference range in ng/mL for the total study sample. The density plot of leptin is shown after ordered quantile transformation. Dotted lines show the 2.5% percentile (left) and 97.5% percentile (right). (b) Differences in serum leptin in males and females. Higher serum leptin was observed in females compared to males. Dot plot showing the differences in median of untransformed values (left) and mean of transformed values (right). *** p < 0.001 of Mann-Whitney U test (left) and Student t-test (right). (c) Reference range of plasma leptin in males (left) and females (right). (d) Scatter plot of leptin and age. (left) Plot on normalized value with Pearson’s correlation test and r coefficients. (right) Plot on untransformed values with Kendall correlation test p-value and tau coefficient. The middle line represents the LOESS fit line with 95% CI shown in the grey area.
Leptin levels change in conditions of metabolic derangement related to obesity and metabolic syndrome. We then identified the optimum cut-off value for leptin for metabolic syndrome and its components (type 2 diabetes mellitus, obesity, and central obesity). We used the 97.5th, 95th, and 90th percentiles of leptin values for males and females to determine sensitivity, specificity, and Youden index [Table 2]. For metabolic syndrome, the 97.5th percentile gave the highest specificity while the best cut-off values were identified at 90th percentile (29.7 ng/mL for males and 71.2 ng/mL for females) with the highest Youden index. A similar observation was observed for 90th percentile for metabolic syndrome components. We next performed receiver operating characteristic analysis to test all possible cut-off values and identify best value from the maximum Youden index. The areas under the curve were best fit for metabolic syndrome, obesity, and central obesity with values above 70.0%. In all these conditions, the cut-off value for leptin was close to the 90th percentile ranging between 24.1–28.9 ng/mL regardless of gender [Figure 3].
Table 2: Optimum cut-off value for leptin in prediction of metabolic syndrome and its components.
|
Metabolic syndrome
|
22.0
|
92.9
|
14.9
|
11.4
|
96.6
|
8.0
|
5.9
|
98.2
|
4.1
|
|
Diabetes
|
10.5
|
90.0
|
0.5
|
5.2
|
95.0
|
0.2
|
2.3
|
97.4
|
-0.3
|
|
Obesity
|
43.9
|
97.0
|
40.9
|
23.9
|
98.9
|
22.8
|
12.2
|
99.4
|
11.6
|
Sens: sensitivity; Spec: specificity; Y: Youden index; M: male; F: female.
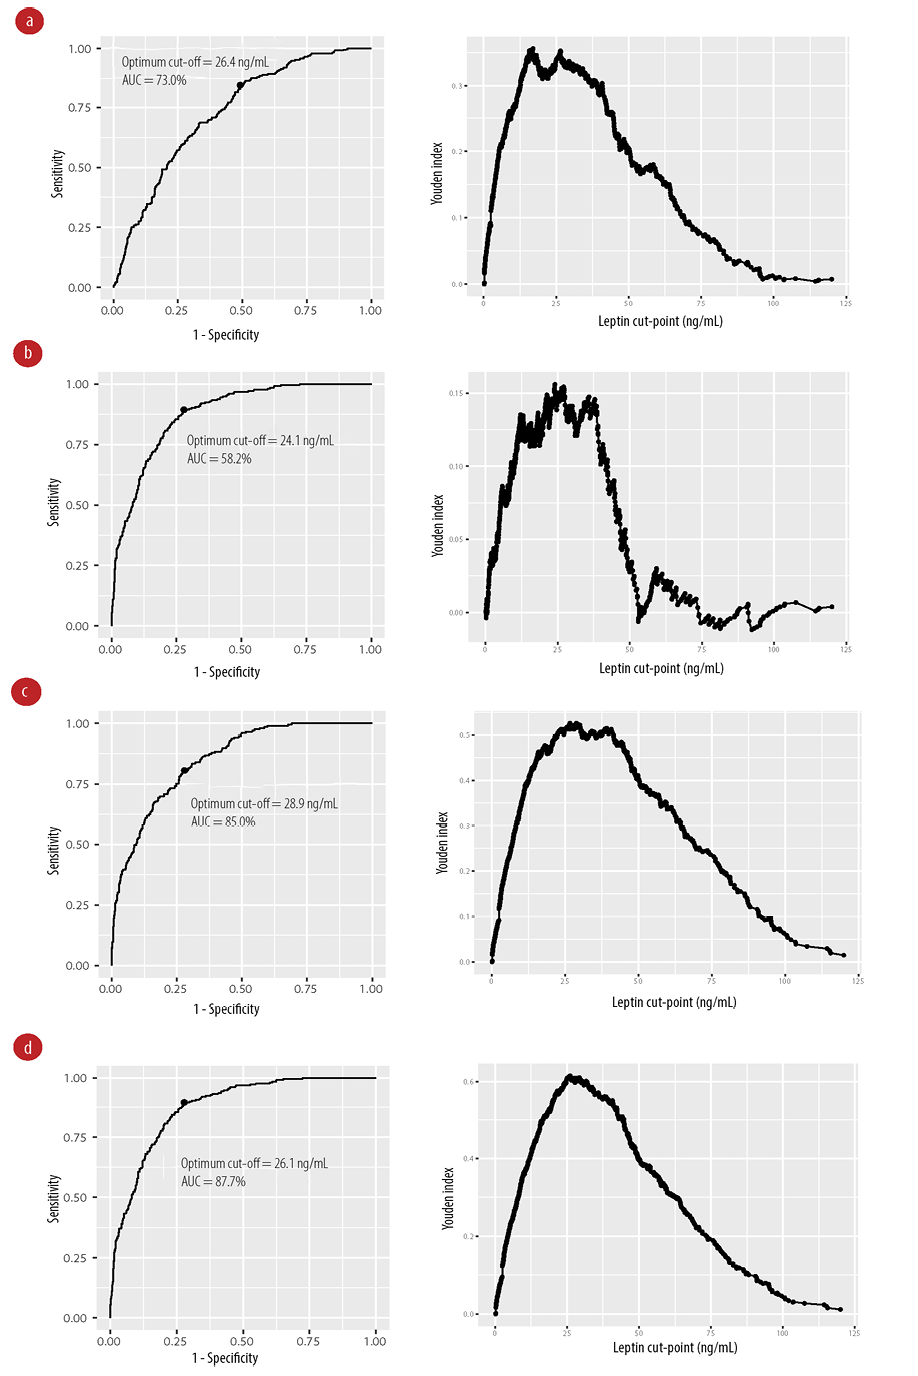 Figure 3: Receiver operating characteristic curves (left) and graphs of the Youden index (right) shown for different conditions. (a) Metabolic syndrome, (b) type 2 diabetes mellitus, (c) obesity, and (d) central obesity.
Discussion
The establishment of a leptin reference range based on the CLSI is warranted for proper clinical diagnosis of lipodystrophies. Leptin values were shown to be different according to ethnicity groups.8 In this study, we identified the reference range for serum leptin in a general Arab population at 0.5–90.6 ng/mL. Female subjects had higher serum leptin levels and gender-specific reference ranges were as follows: for males 0.25–48.8 ng/mL and for females 4.9–96.3 ng/mL. The optimum cut-off value for leptin for metabolic syndrome, obesity, central obesity, and type 2 diabetes was identified between 24.1–28.9 ng/mL. In our study, leptin values were higher to those reported in other populations (Chinese, Aboriginals, and Caucasians).
We identified higher serum leptin levels in females, similar to other studies. In Chinese women (aged 20–81 years), the reference level of serum leptin in normal-weight females was 5.30–12.6 ng/mL.19 Another study of Spanish adults identified higher levels of leptin in females compared to males with a median of 24.5 [IQR = 14.1–37.0] ng/mL in females, and 7.2 [IQR = 3.3–14.3] ng/mL in males.20 In a study of adults in Saudi Arabia, serum leptin was higher in females for both non-obese (8.8 ng/mL for females and 2.2 ng/mL for males) and obese individuals (23.0 ng/mL for females and 12.5 ng /mL for males).21 Another study from the UAE showed that obese females had a higher median leptin levels than obese males (41.3 ng/mL for females and 22 ng/mL for males).22 The difference between leptin level in males and females is explained by variations in leptin secretion rates in vitro and the fat mass.23 The rate of leptin secretion is increased in women, and regardless of BMI women have higher adipose tissue mass than men.24 It is plausible that these sex differences are related to a lower response of leptin in the central nervous system in women.23
Ethnic variation in serum leptin is evident. By comparing mean values of leptin in multiple ethnicities, we observed higher values within Arabs [Table 3]. Three national studies for leptin reference range were performed in Spain,20 Canada,8 and the USA.25 All these studies reported mean values lower than the Arab population. Two studies in the UAE and Saudi Arabia showed that leptin levels are different depending on the obesity status of study subjects and overall studies in such case-control study design were not reported.21,22 This ethnic variation is a result of differences in body weight and fat distribution. Thus, leptin levels are dependent on the prevalence of increased adiposity in the studied cohort. This was evident in the US National Health and Nutrition Examination Survey (NHANES) which reported leptin levels were different when the population was studied in NHANES-1 1988–1994,26 and the report NHANES-III 20 years later.25 Lower leptin levels in NHANES-1 data were attributed to a lower prevalence of obesity in the USA in that period. The obesity trend in Northern America is increasing and this reflected in a higher reported leptin levels in 2009.27 This signifies the need to establish a population-specific reference range for serum leptin due to inter-racial differences in body fat and mass composition.
Table 3: Leptin levels (ng/mL) in different reported populations.
|
Canadian - South Asian7
|
22.87 (1.54)
|
7.24 (0.60)
|
|
Canadian - Aboriginal7
|
16.95 (2.07)
|
5.37 (1.39)
|
|
Canadian - Europeans7
|
13.60 (1.36)
|
5.93 (0.86)
|
|
Canadian - Chinese7
|
14.01 (1.21)
|
5.37 (0.88)
|
|
Saudi Arabia - normal weight21
|
8.8 (2.10)
|
2.2 (0.26)
|
|
Saudi Arabia - obese subjects21
|
23.0 (4.0)
|
18.7 (1.7)
|
|
UAE - obese subjects22
|
41.3 (3.2–105)
|
22 (8.9–54.3)
|
|
USA - healthy24
|
17.8 (12.0)
|
5.9 (4.0)
|
|
Spain19
|
21.9 (0.25)
|
6.6 (0.12)
|
Data shown are mean (SD) in ng/mL except for UAE study showing
median (range).
The current limitation of the study is its cross-sectional design, these cut-offs need to be validated in prospective design to have a stronger prediction for outcome based on incidence.
Conclusion
Our study identified a reference range for serum leptin for females (4.9–96.3 ng/mL) and males (0.25–48.8 ng/mL) in Arabs. The optimum cut of point of serum leptin for metabolic derangements was identified between 24.1–28.9 ng/mL.
Disclosure
The authors declared no conflicts of interest. Informed consent was obtained from all individuals when recruited in Oman Family Study. This work was supported by His Majesty Trust Fund (Grant SR/MED/PHYS/04/ 01).
references
- 1. Baban RS, Kasar KA, Al-Karawi IN. Fasting glucose to leptin ratio as a new diagnostic marker in patients with diabetes mellitus. Oman Med J 2010 Oct;25(4):269-275.
- 2. Chan JL, Mantzoros CS. Role of leptin in energy-deprivation states: normal human physiology and clinical implications for hypothalamic amenorrhoea and anorexia nervosa. Lancet 2005 Jul;366(9479):74-85.
- 3. Park HK, Ahima RS. Physiology of leptin: energy homeostasis, neuroendocrine function and metabolism. Metabolism 2015 Jan;64(1):24-34.
- 4. Robertson SA, Leinninger GM, Myers MG Jr. Molecular and neural mediators of leptin action. Physiol Behav 2008 Aug;94(5):637-642.
- 5. Klok MD, Jakobsdottir S, Drent ML. The role of leptin and ghrelin in the regulation of food intake and body weight in humans: a review. Obes Rev 2007 Jan;8(1):21-34.
- 6. Farooqi IS, Jebb SA, Langmack G, Lawrence E, Cheetham CH, Prentice AM, et al. Effects of recombinant leptin therapy in a child with congenital leptin deficiency. N Engl J Med 1999 Sep;341(12):879-884.
- 7. Roth JD, Roland BL, Cole RL, Trevaskis JL, Weyer C, Koda JE, et al. Leptin responsiveness restored by amylin agonism in diet-induced obesity: evidence from nonclinical and clinical studies. Proc Natl Acad Sci U S A 2008 May;105(20):7257-7262.
- 8. Mente A, Razak F, Blankenberg S, Vuksan V, Davis AD, Miller R, et al; Study of the Health Assessment And Risk Evaluation in Aboriginal Peoples Investigators. Ethnic variation in adiponectin and leptin levels and their association with adiposity and insulin resistance. Diabetes Care 2010 Jul;33(7):1629-1634.
- 9. Morimoto Y, Conroy SM, Ollberding NJ, Kim Y, Lim U, Cooney RV, et al. Ethnic differences in serum adipokine and C-reactive protein levels: the multiethnic cohort. Int J Obes (Lond) 2014 Nov;38(11):1416-1422.
- 10. Nicklas BJ, Toth MJ, Goldberg AP, Poehlman ET. Racial differences in plasma leptin concentrations in obese postmenopausal women. J Clin Endocrinol Metab 1997 Jan;82(1):315-317.
- 11. Alkaf B, Blakemore AI, Järvelin MR, Lessan N. Secondary analyses of global datasets: do obesity and physical activity explain variation in diabetes risk across populations? Int J Obes (Lond) 2021 May;45(5):944-956.
- 12. Man T, Nolte IM, Jaju D, Al-Anqoudi ZA, Muñoz ML, Hassan MO, et al. Heritability and genetic correlations of obesity indices with ambulatory and office beat-to-beat blood pressure in the Oman family study. J Hypertens 2020 Aug;38(8):1474-1480.
- 13. Zadjali F, Al-Yahyaee S, Hassan MO, Albarwani S, Bayoumi RA. Association of adiponectin promoter variants with traits and clusters of metabolic syndrome in Arabs: family-based study. Gene 2013 Sep;527(2):663-669.
- 14. Clinical and Laboratory Standards Institute. Defining, establishing, and verifying reference intervals in the clinical laboratory. 2010 [cited 2022 March]: Available from: https://clsi.org/media/1421/ep28a3c_sample.pdf.
- 15. Hassan MO, Albarwani S, Al Yahyaee S, Al Haddabi S, Rizwi S, Jaffer A, et al. A family study in Oman: large, consanguineous, polygamous Omani Arab pedigrees. Community Genet 2005;8(1):56-60.
- 16. Alberti KG, Zimmet P, Shaw J, Group ID; IDF Epidemiology Task Force Consensus Group. The metabolic syndrome–a new worldwide definition. Lancet 2005 Sep;366(9491):1059-1062.
- 17. The R Development Core Team. R: a language and environment for statistical computing. 2010 [cited 2022 March]. Available from: https://www.r-project.org/index.html.
- 18. Peterson RA, Cavanaugh JE. Ordered quantile normalization: a semiparametric transformation built for the cross-validation era. J Appl Stat 2019 Jun;47(13-15):2312-2327.
- 19. Zhang R, Liao E, Wu X, Xie H, Shan P, Zhang H, et al. [Concentration of serum leptin and age in Chinese women and comparison with other races]. Zhong Nan Da Xue Xue Bao Yi Xue Ban 2009 Nov;34(11):1136-1141.
- 20. Gijón-Conde T, Graciani A, Guallar-Castillón P, Aguilera MT, Rodríguez-Artalejo F, Banegas JR. Leptin reference values and cutoffs for identifying cardiometabolic abnormalities in the Spanish population. Rev Esp Cardiol (Engl Ed) 2015 Aug;68(8):672-679.
- 21. Al-Sultan AI, Al-Elq AH. Leptin levels in normal weight and obese Saudi adults. J Family Community Med 2006 Sep;13(3):97-102.
- 22. Adeyemi E, Abdulle A. A comparison of plasma leptin levels in obese and lean individuals in the United Arab Emirates. Nutr Res 2000;20(2):157-166.
- 23. Wauters M, Van Gaal L. Gender differences in leptin levels and physiology: a role for leptin in human reproduction. J Gend Specif Med 1999;2(5):46-51.
- 24. Hellström L, Wahrenberg H, Hruska K, Reynisdottir S, Arner P. Mechanisms behind gender differences in circulating leptin levels. J Intern Med 2000 Apr;247(4):457-462.
- 25. Sierra-Johnson J, Romero-Corral A, Lopez-Jimenez F, Gami AS, Sert Kuniyoshi FH, Wolk R, et al. Relation of increased leptin concentrations to history of myocardial infarction and stroke in the United States population. Am J Cardiol 2007 Jul;100(2):234-239.
- 26. Ruhl CE, Everhart JE, Ding J, Goodpaster BH, Kanaya AM, Simonsick EM, et al; Health, Aging, and Body Composition Study. Serum leptin concentrations and body adipose measures in older black and white adults. Am J Clin Nutr 2004 Sep;80(3):576-583.
- 27. Shah NR, Braverman ER. Measuring adiposity in patients: the utility of body mass index (BMI), percent body fat, and leptin. PLoS One 2012;7(4):e33308.