|
Abstract
Objective: To examine the association between socio-economic status and adult mortality in a rural South African community.
Methods: Longitudinal data of adults aged 15-64 yrs residing within the Demographic Surveillance Area [DSA] on 1st January 2001 and followed up for seven years, was used. Out of the total 33,677 adults who met the inclusion criteria, 4,058 died during the seven years follow up period. Mortality rates were computed using Kaplan-Meier survival estimates expressed per 1000 person-year of observation (PYO). Household wealth index was constructed by the use of PCA, while the association was assessed using Cox proportional Hazard model controlling for potential confounders such as age, sex and marital status.
Results: The high group of the socioeconomic quintile had the highest mortality rate of 22.2 per 1000 PYO, 95% confidence interval (20.7-23.7). After adjusting for the potential confounders, the effect of socioeconomic status in the highest SES category was 0.10 times less likelihood of death compared to the lowest SES group (Hazard Ratio=0.90; p=0.042; 95% confidence interval [0.81-0.99]).
Conclusion: This study revealed that adult socioeconomic status is not significantly associated with adult mortality. Reducing the gap between the rich and the poor, though a worthwhile effort; might not be the most effective means of reducing adult mortality.
Keywords: Adult mortality; Longitudinal data; Demographic surveillance site; Africa; Cox.
Introduction
Adult mortality has long been neglected as a public health issue in many countries around the globe, particularly in sub-Saharan Africa, where the countries have been battling other developmental issues. With increasing levels of adult mortality in the region, interest in understanding the context of adult mortality is growing.1-3 While the ability of the health systems on the African continent to provide immediate and quality healthcare to people is noted; the socioeconomic status of the population could play a better role in averting the deaths, which in many ways are avoidable.
Socioeconomic status has been a very major factor in the fight against morbidity and mortality. This is because it determines the amount of resources (such as food, good sanitation, and healthcare) that may be available to the individual, which in turn suggests the kind of physical and environmental elements one will be exposed to and their ability to save their life from dying from infections and diseases. Literature suggests that individuals with higher socioeconomic status often tend to have higher survival than those with lower socioeconomic status.4-6
While many studies have reported on the association between SES and different kinds of diseases elsewhere,7 studies on the methods and processes of measuring SES, especially using asset components have been quite well documented.8,9 Jakovljevic (2001) has indicated serious problems in the measurement of socioeconomic status (SES) as most studies are cross-sectional.10 With the emerging demographic surveillance sites (DSS) collecting very reliable data on the continent, an accurate measure of the association between SES and adult mortality is possible.11,12
This study was based on the theoretical model proposed by Roger et al. (2005) which holds that the causal pathway to adult mortality flows from distal factors such as geographical factors, human and environmental hazards and socioeconomic influences.6 These factors in turn flow through proximate determinants like living conditions, behavior, injury prone, nutrition, which in turn cause morbidity and mortality.
Methods
Data for this study was extracted from the Africa Centre Demographic Information System (ACDIS) relational database which contained information on individual and household memberships, births, deaths, residence status, and household assets linked in a relational form. The ACDIS is situated in the northern part of the Hlabisa (UmKhanyakude) district in the Kwazulu-Natal Province of South Africa. The Demographic Surveillance Area (DSA) covers an approximate area of 430 square kilometres and has a population of about 90,000 with a total of some 11,000 households housed in over 12,000 bounded structures.
The study participants were all adults aged between 15 and 64 years, living within the Africa Centre Demographic Surveillance Area (ACDSA) between the years 2001 and 2007.13 This is a prospective closed cohort study using longitudinal data collected over seven years. Only persons aged between 15 and 64 years and residing within the ACDSA on January 2001 were included in the study. A total of 33,677 adults met the criteria and were included in the study.
Sample number for data analysis was then followed up over the seven year period to detect the outcome of death. A total of approximately 6924 exited out of the initial cohort of 33,677 at different time points of the follow-up period. Those who exited and followed-up for 3.14 years differed significantly in terms of their age and sex characteristics from those who remained. However, since the study was a closed cohort, the participants who exited were not traced and re-entered into the cohort after they had exited. In total, 10,077 deaths were recorded within the DSA between 1st January 2001 and 31st December 2007. Out of this number, 4,359 were deaths of adults aged 15-64 years, but the deaths of 301 adults did not have matching SES information after cleaning and merging, and hence were removed from the analysis. Thus, our analysis is based on 4,058 adult deaths with complete SES information.
In terms of variables definition and extraction; socioeconomic status proxied by wealth index was constructed using the principal component analysis (PCA). The PCA creates indices that are not correlated, where each index is a linear weighted combination of the initial variables.8,9 The PCA was based on a formula where each component is a linear weighted combination of all the initial variables. After the indexes have been created, each individual was assigned to his/her proper household wealth index using household identification numbers. The first principal component was then used to divide individuals into quintiles of lowest, low, middle, high and highest, which became the proxy measure of the socioeconomic status.
Adult (aged 15-64 years) mortality rate was measured by dividing the total number of deaths in a wealth quintile by the calculated person years observed between 2001 to 2007 for all deaths occurring within the age group of 15-64 years in that particular quintile, expressed in 1000 person years of observation (PYO). Confounding variables were age, sex, education, marital status and employment. Age was categorized into 10 year groups (15-24, 25-34 to 55-64) during the descriptive analysis but was included as a continuous variable during the modelling part of the analysis. Education was categorized into four groups: no education (none), primary education, secondary and tertiary level. Marital status also had 5 categories: married, single, separated/divorced and widowed.
Data analysis was done using Kaplan-Meier estimates (K-M) for computing the adult mortality rates. The quintile specific rates between two age groups (below 40 years and above 40 years) were also investigated to determine the impact of HIV/AIDs on mortality between the two age groups. Whereas, univariate and multivariate analyses were done using the Cox Proportional Hazard model, three models were fitted. The univariate hazard model was used to assess variables independently to predict adult mortality. The multivariate hazard model was used to adjust for all the variables. The third level of analysis was a stratified multivariate model by two main age groups: <40 years and >40 years, to determine the variability in the death hazards due to SES among the different age groups.
Results
The socio-demographic characteristics of the study population through simple descriptive analysis showed that over two-thirds were younger adults (<35 yrs; 65%), and the rest belonged in the older category (35 yrs and above). Almost half of the study participants had completed secondary education at the time of the study (46%), and 12% had no education. While more than half of the deaths were due to HIV and TB (60%), with the rest due to all other causes. (Table 1)
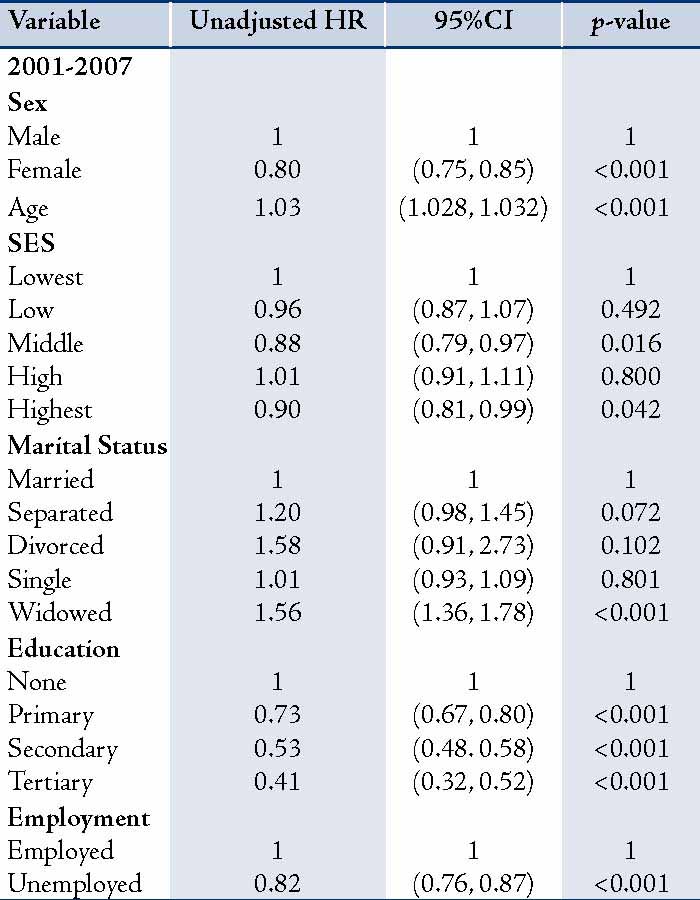
Table 1: Univariate Cox Model for adult mortality in ACDSA 2001 - 2007.
For adult mortality rate; the overall all-cause mortality rate recorded from 2001 to 2007 briefly increased from 19 per 1000 PYO in 2001 to 19.5 per 1000 PYO in 2002; and from there, it increased to 22.5 per 1000 PYO in 2003. Since then, the rate has remained fairly stable fluctuating between 21 and 22 per 1000 PYO. The overall mortality rate was 20.85 per 1000 PYO, 95% CI (20.2 - 21.5) (Fig 1). The high group of the socioeconomic quintile had the highest mortality rate of 22.2 per 1000 PYO, 95% CI (20.7 - 23.7). The rate in each SES quintile varied by sex and age group regardless of the SES quintal, showing males with significantly higher mortality rate than females in all the SES quintiles. (Table 2 &Fig. 2)
Table 2: Overall adult mortality rate by SES category in ACDSA.
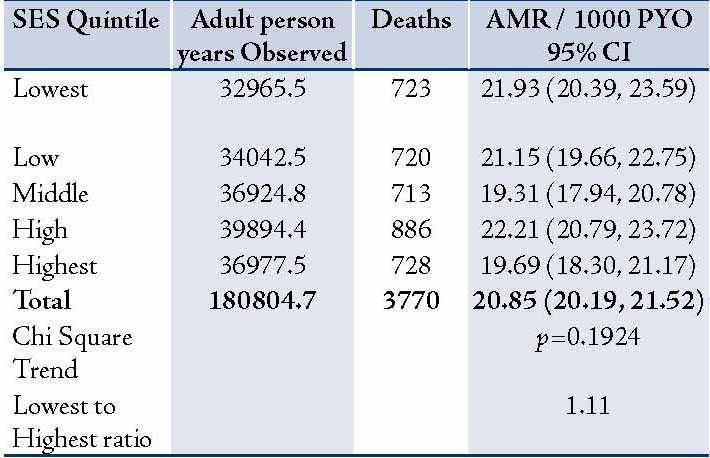
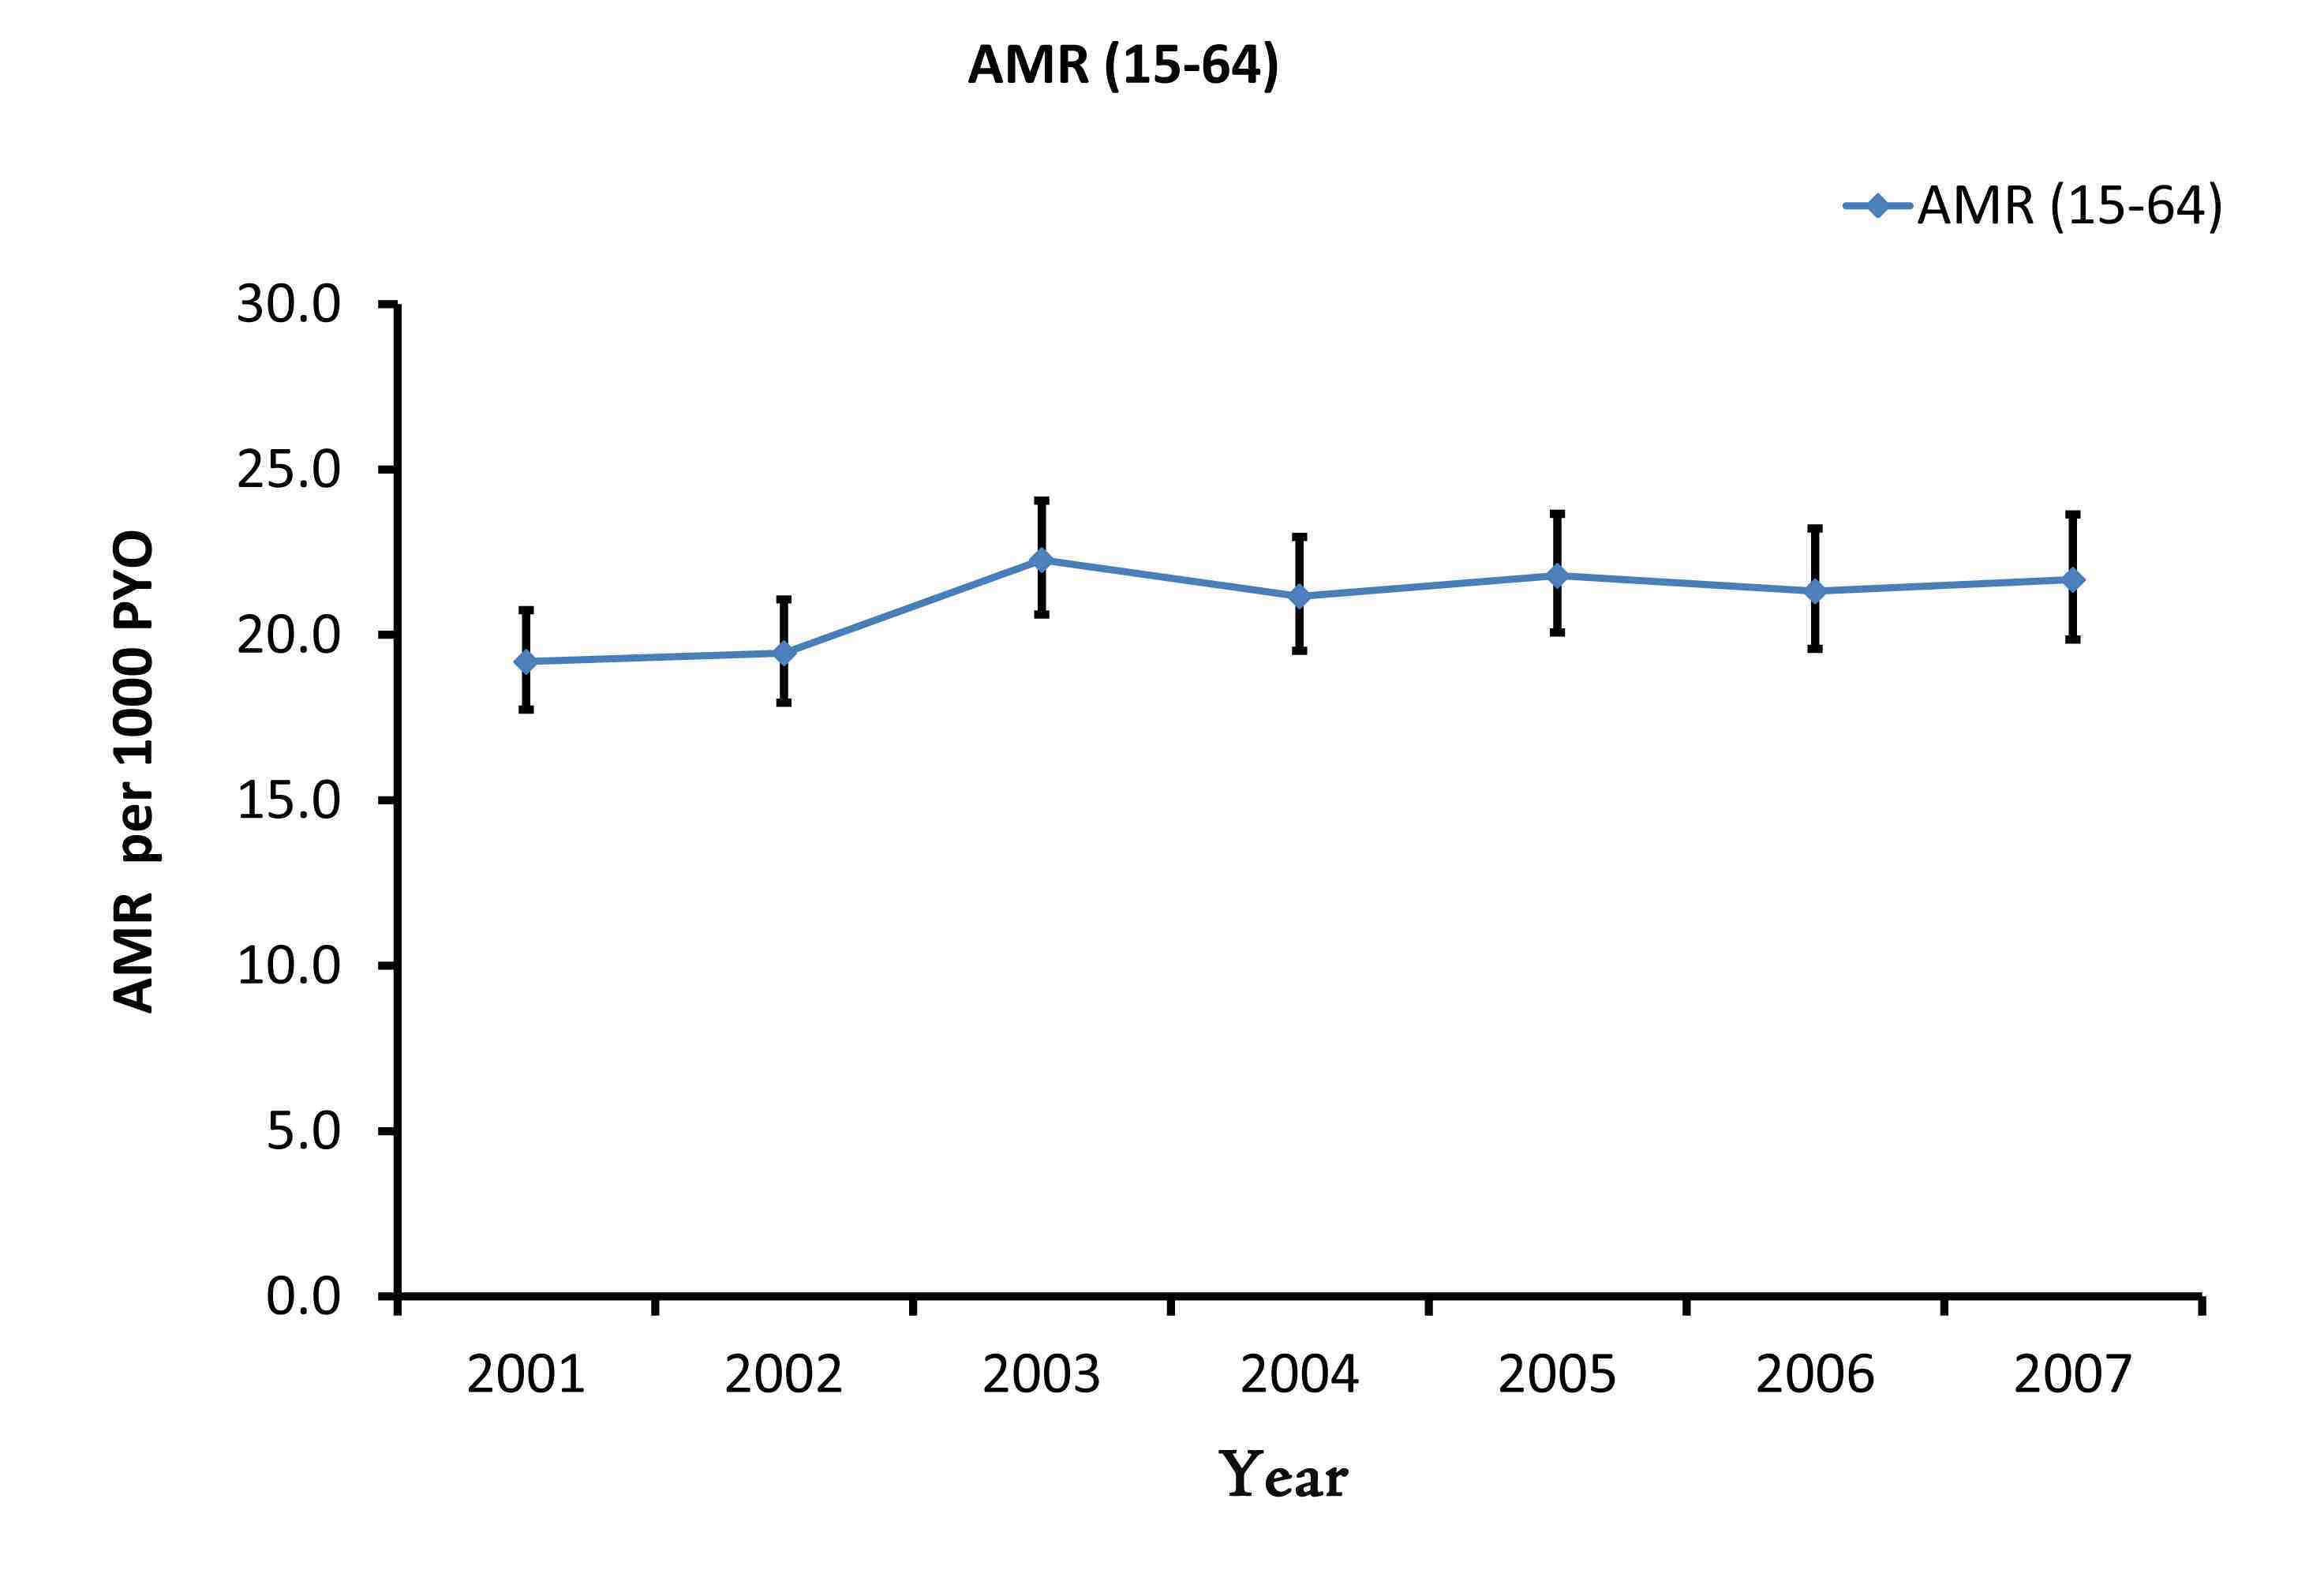
Figure 1: Overall adult mortality rate (AMR) in ACDSA 2001 - 2007.
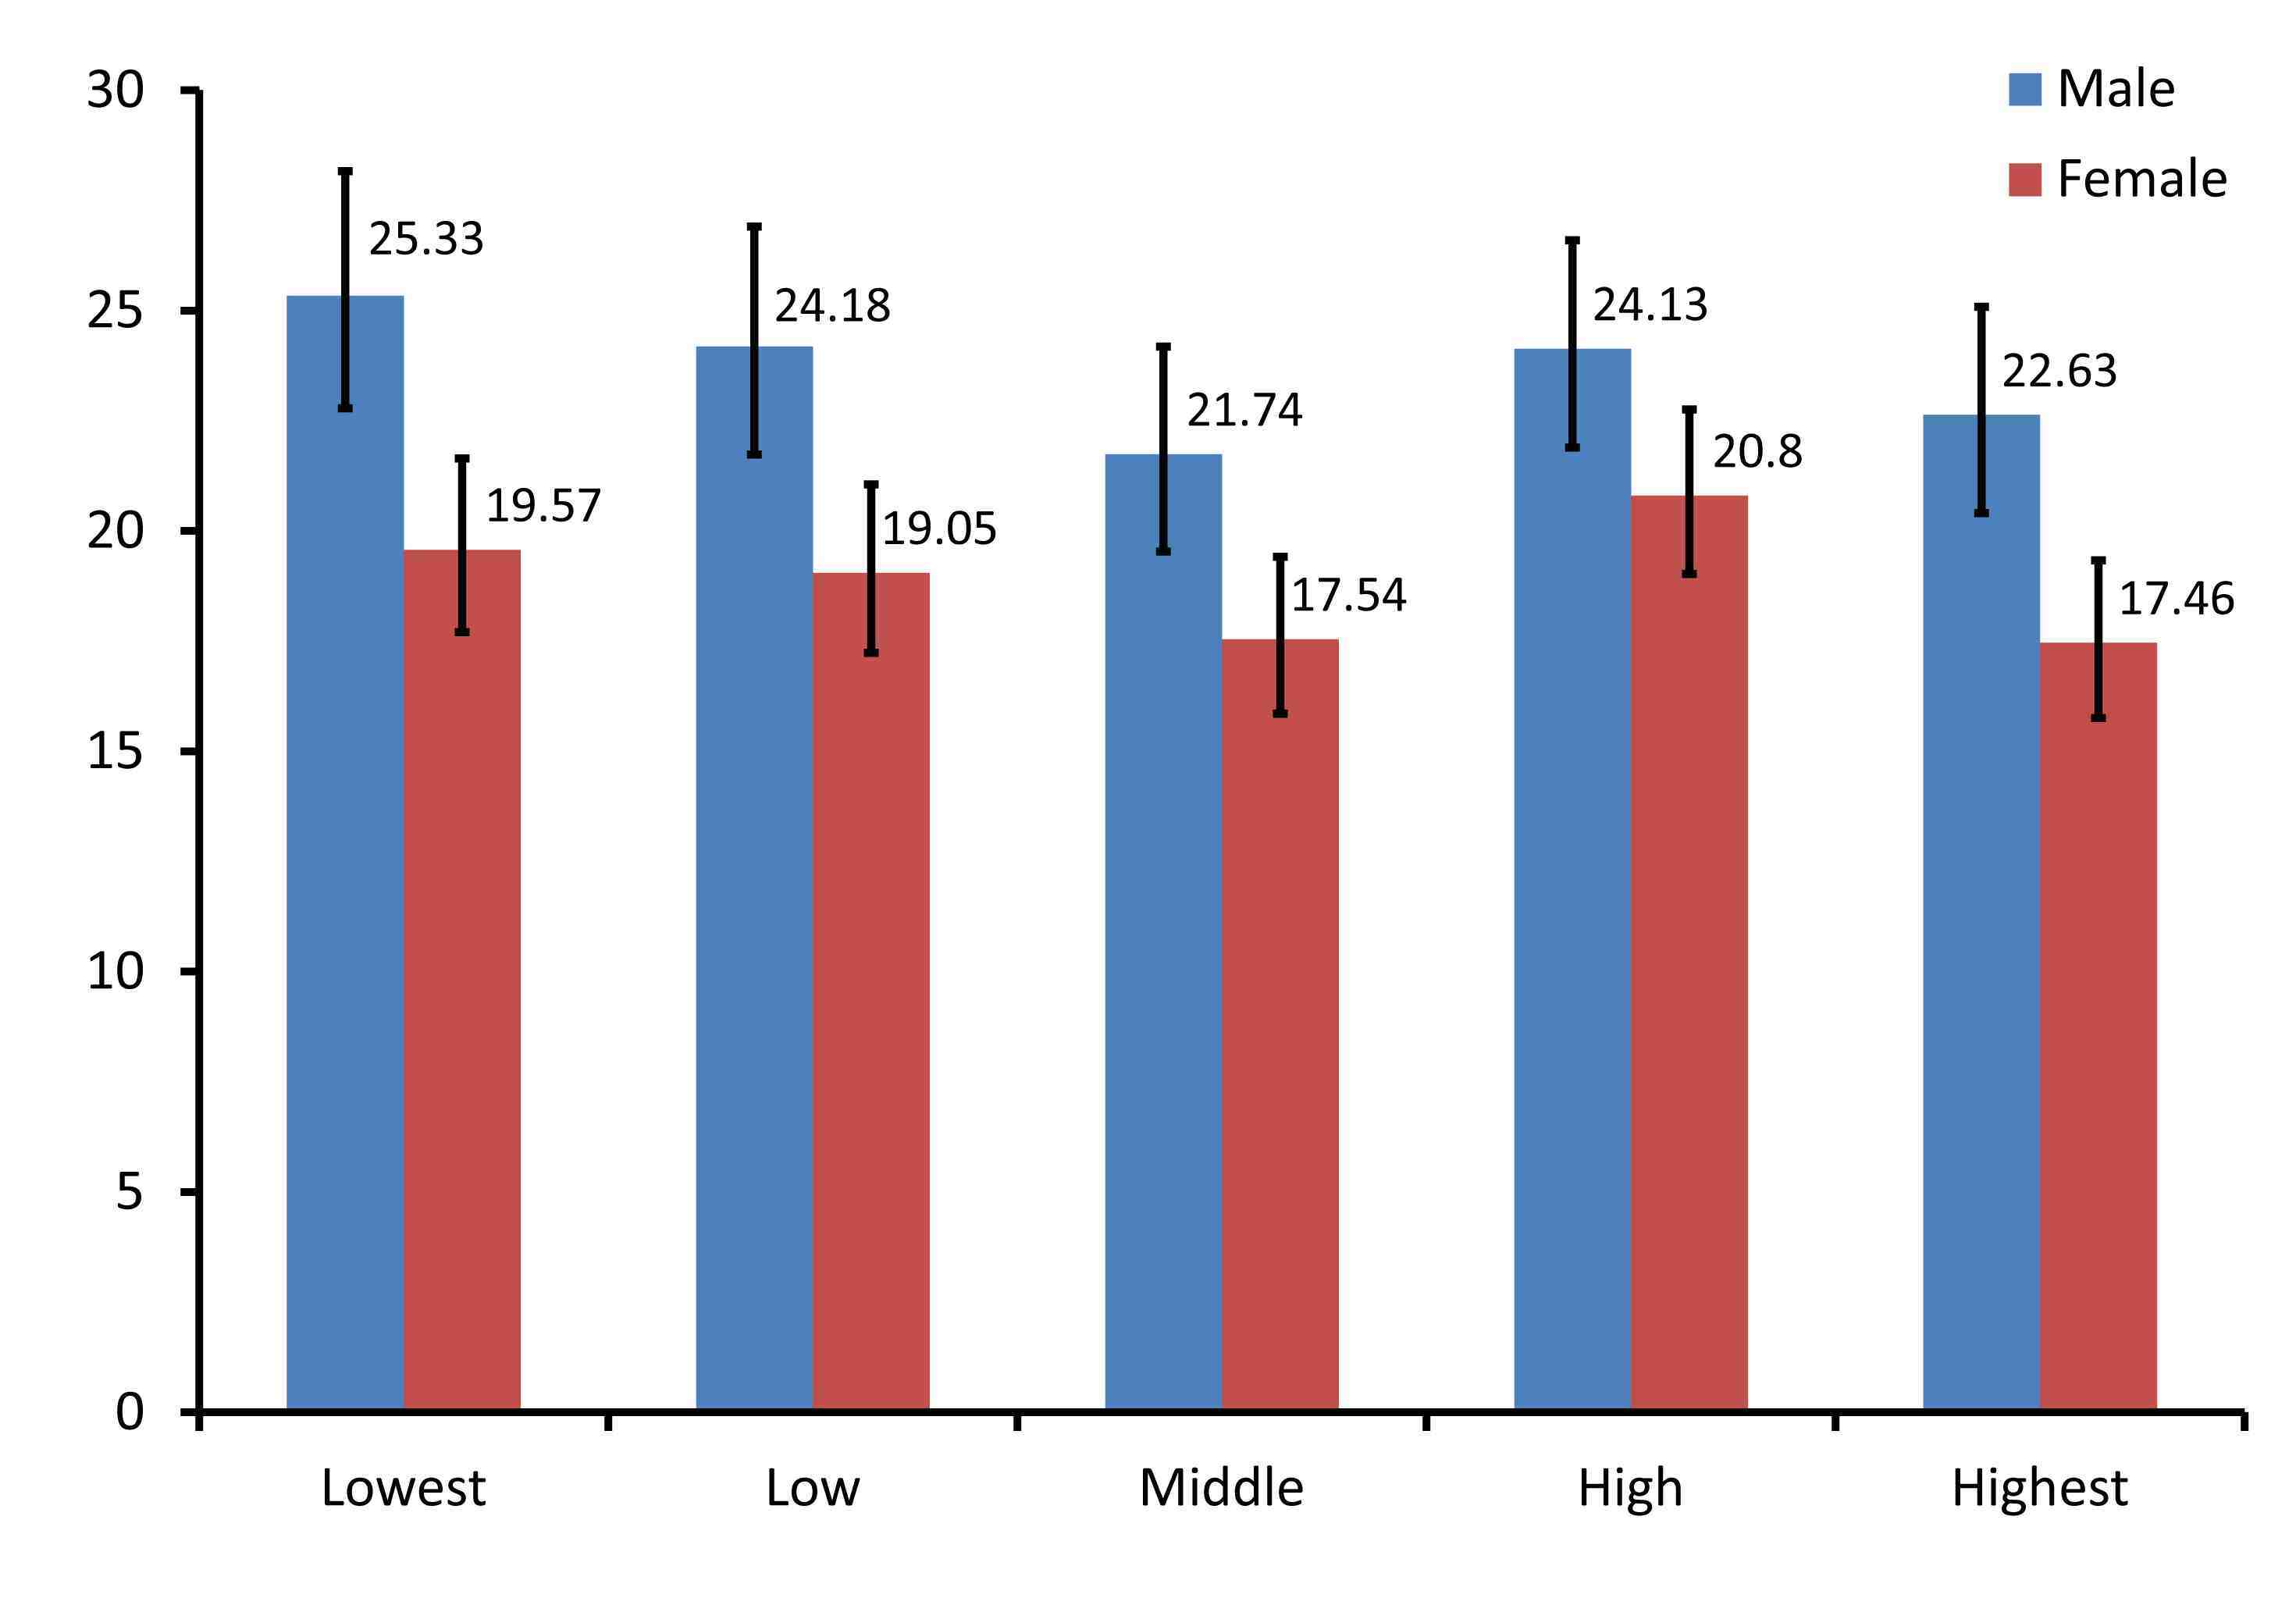
Figure 2: Adult mortality rate by SES category and sex in ACDSA.
In the low SES quintile, there was a significant difference in mortality rate of 6 per 1000 PYO between males and females. The difference in rates in terms of gender was however, not significant for the high SES category. (Fig. 3)
Individuals in the two main age groups; younger (≤40 yrs) and older (>40 yrs) had varying rates across all SES quintiles as shown in Fig 4. For each SES quintile, the rates for older adults were on average two times that of the younger adults. The survival probabilities for males and females decreased at a constant rate with time; it also varied with age. The females exhibited better survival than the males throughout the follow-up period. On the whole, the lowest age group (15-24 yrs) encompassed the highest chance of survival; whereas, the older age group (55-64 yrs) exhibited the lowest chance of survival.
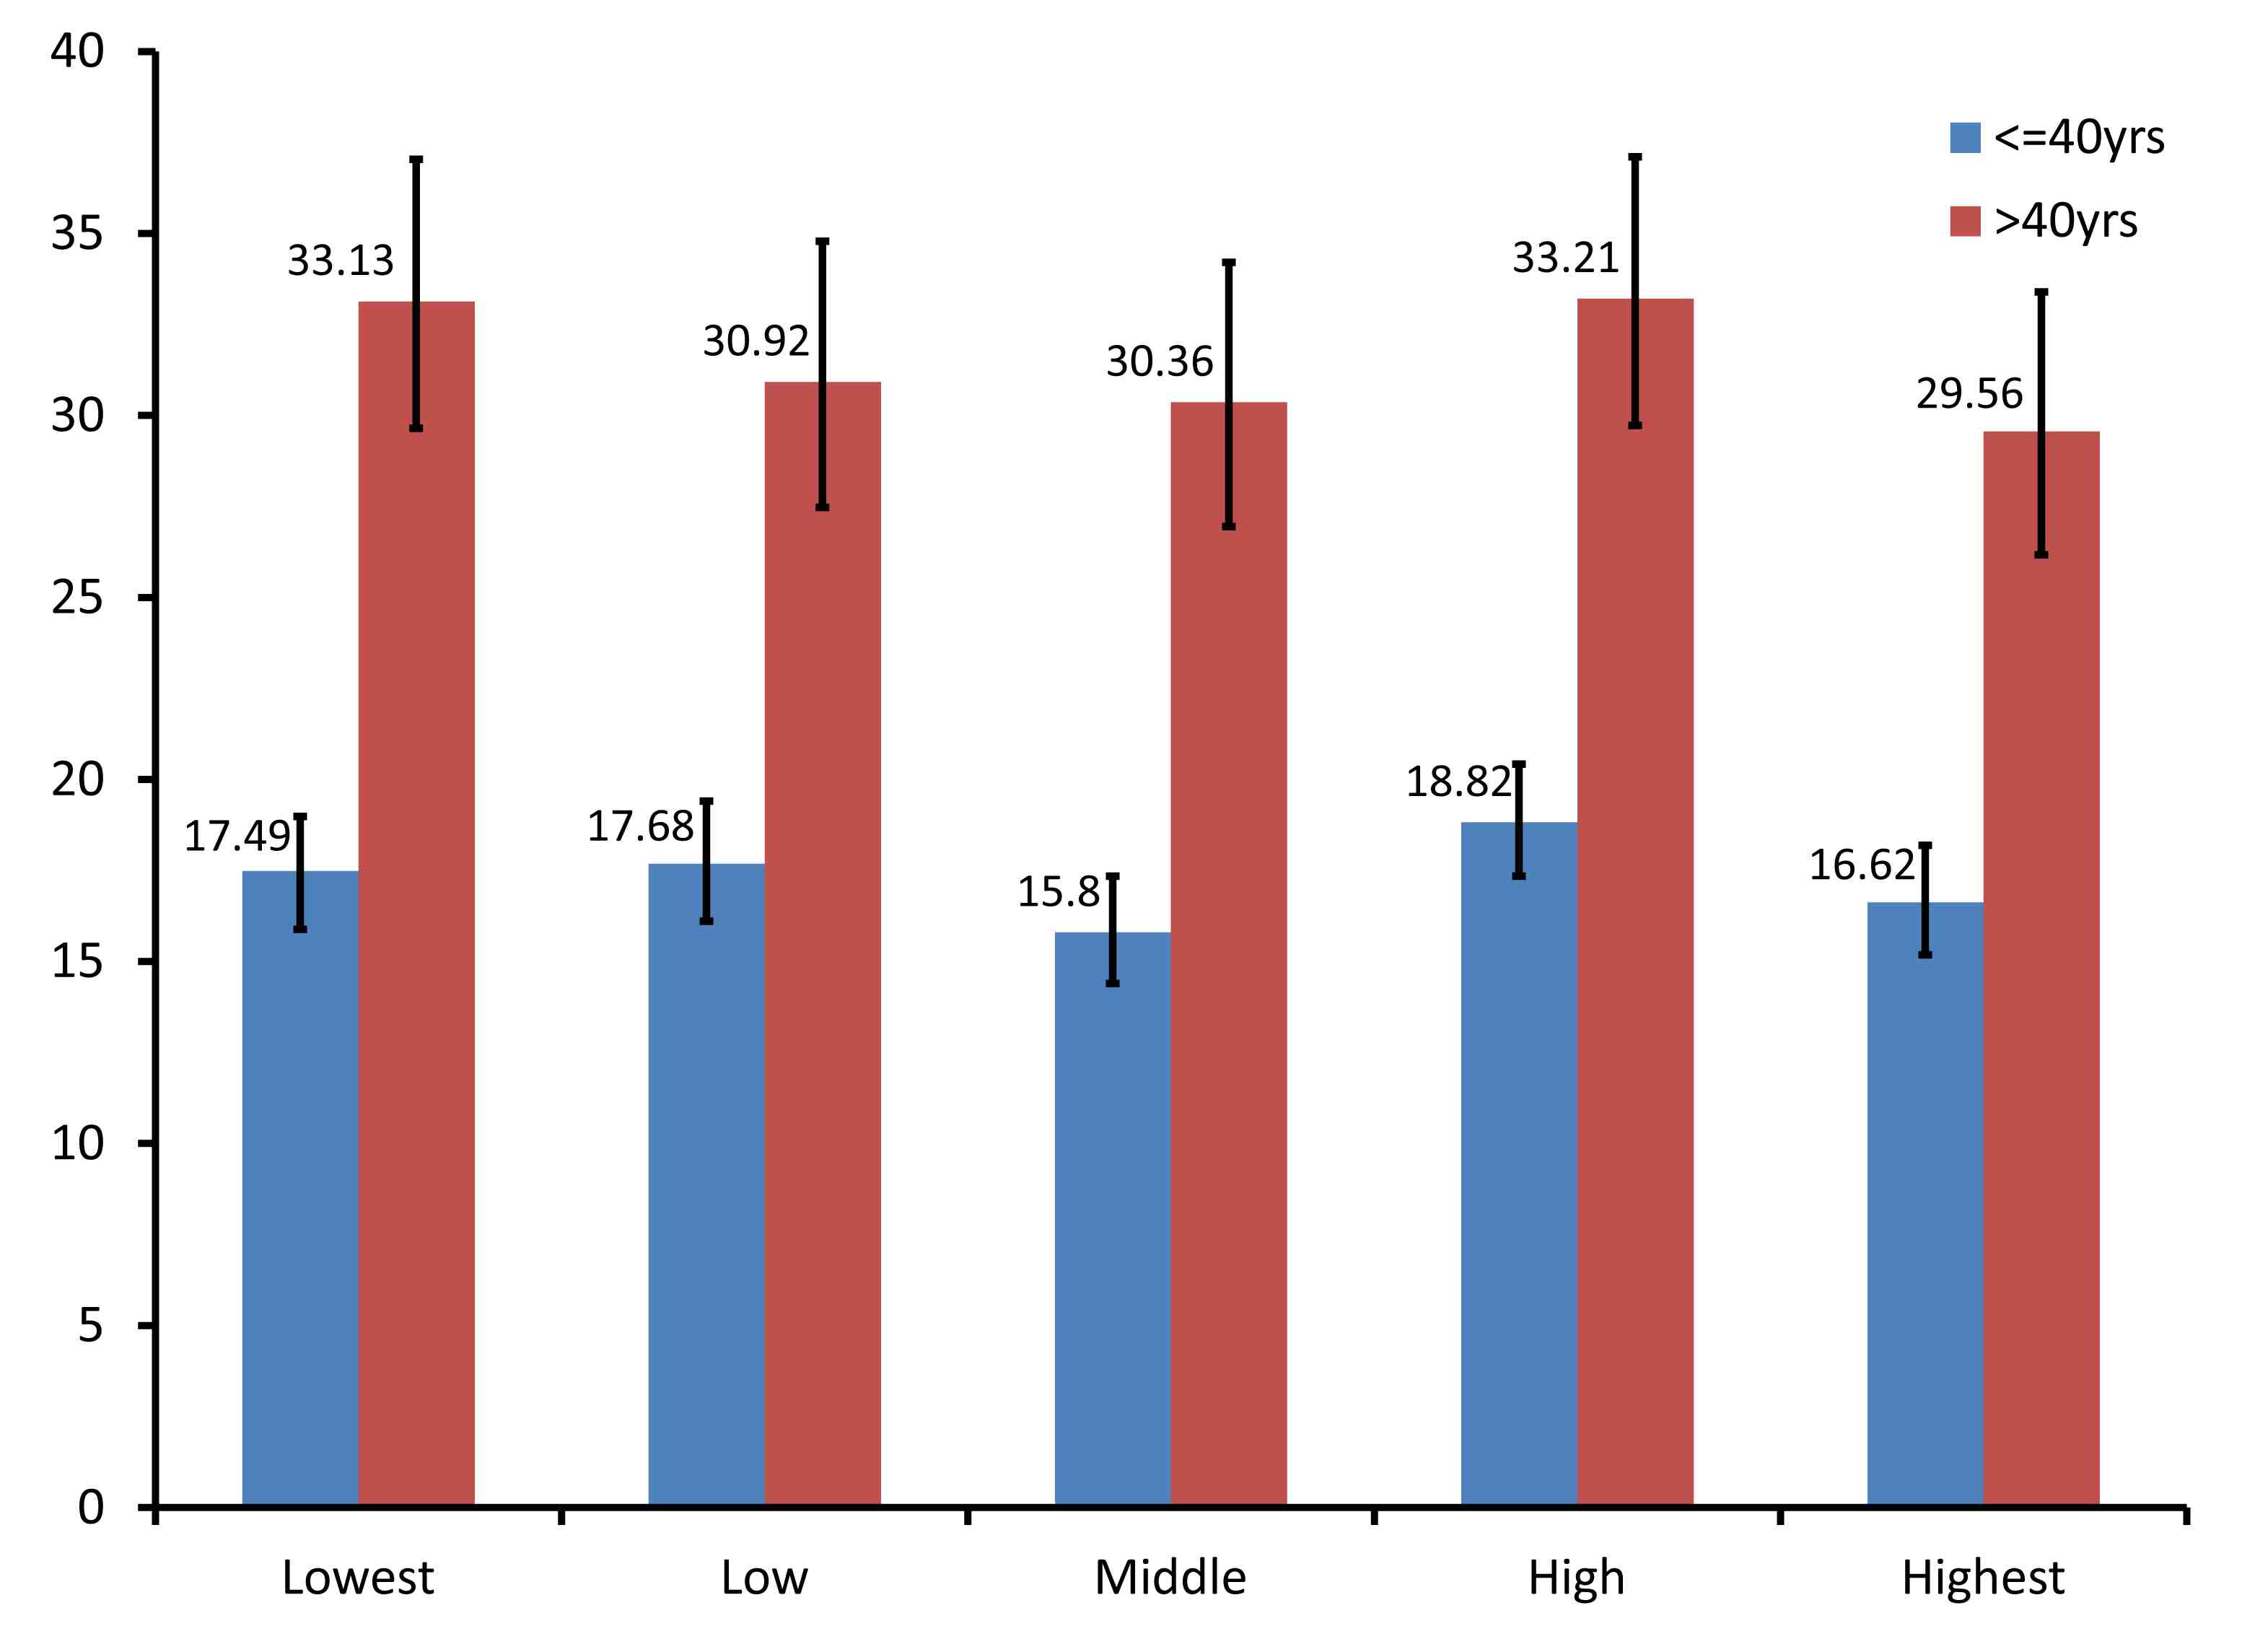
Figure 3: Adult mortality rate by SES category and age in ACDSA.
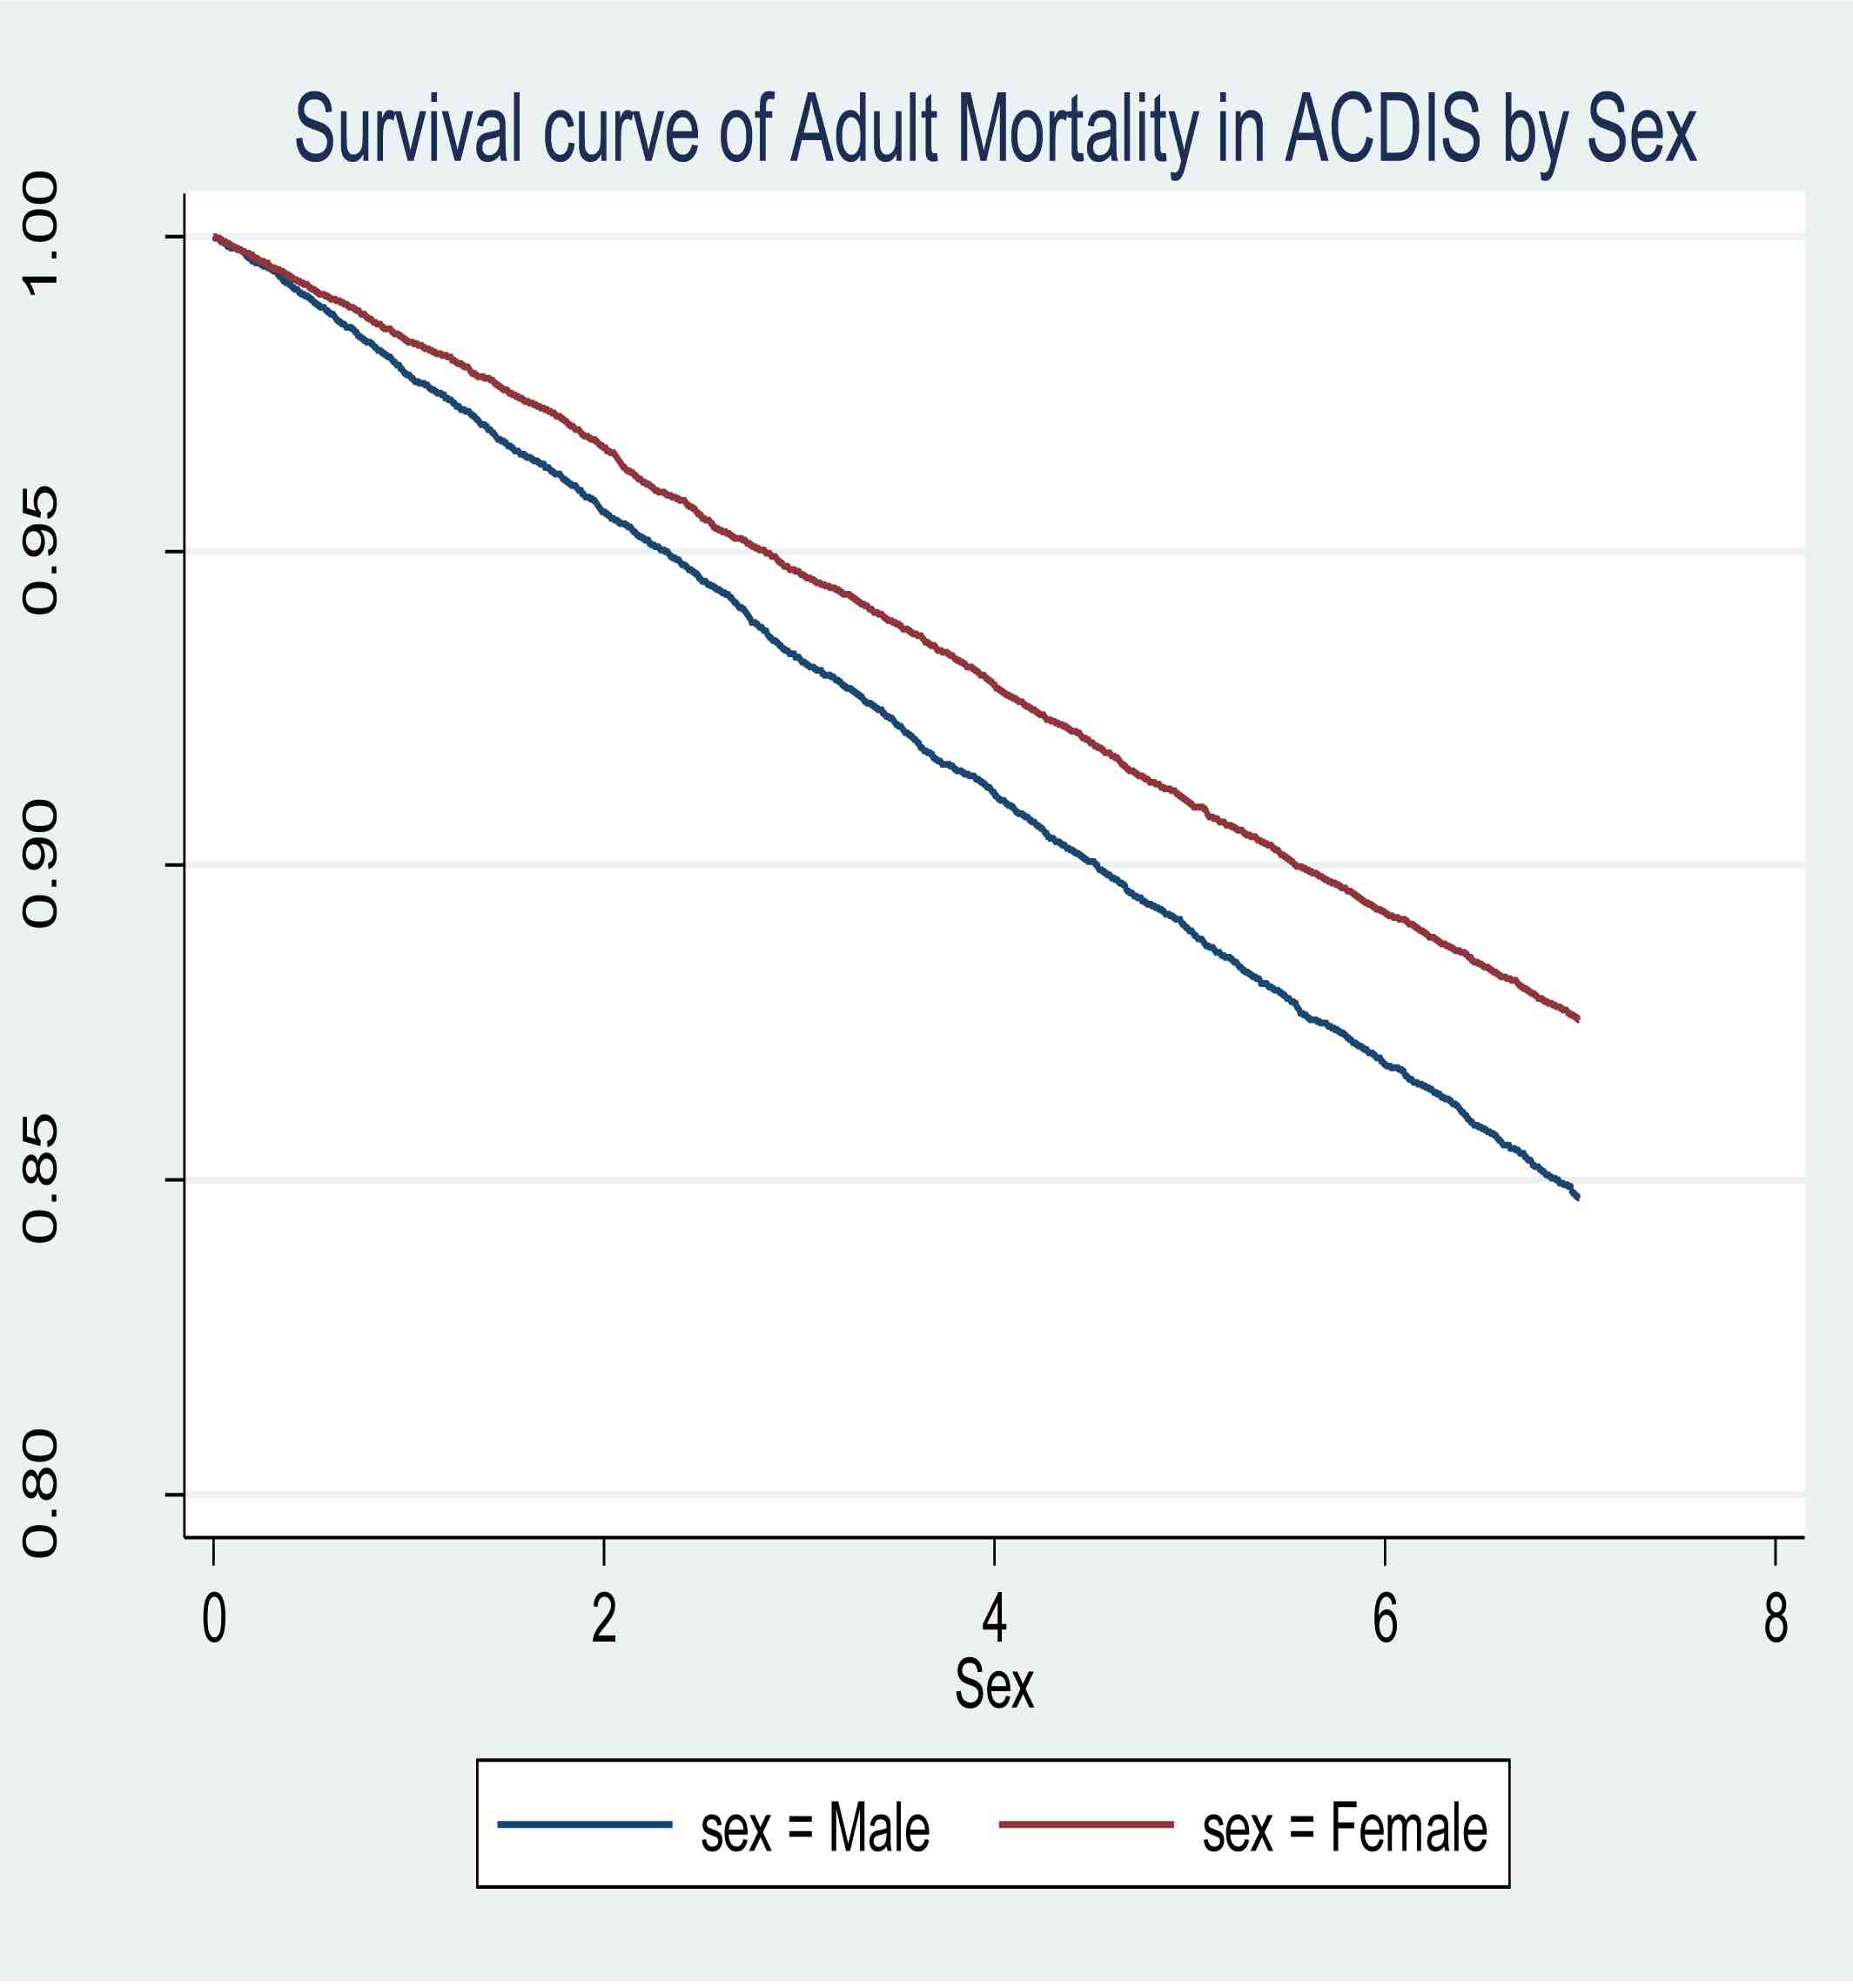 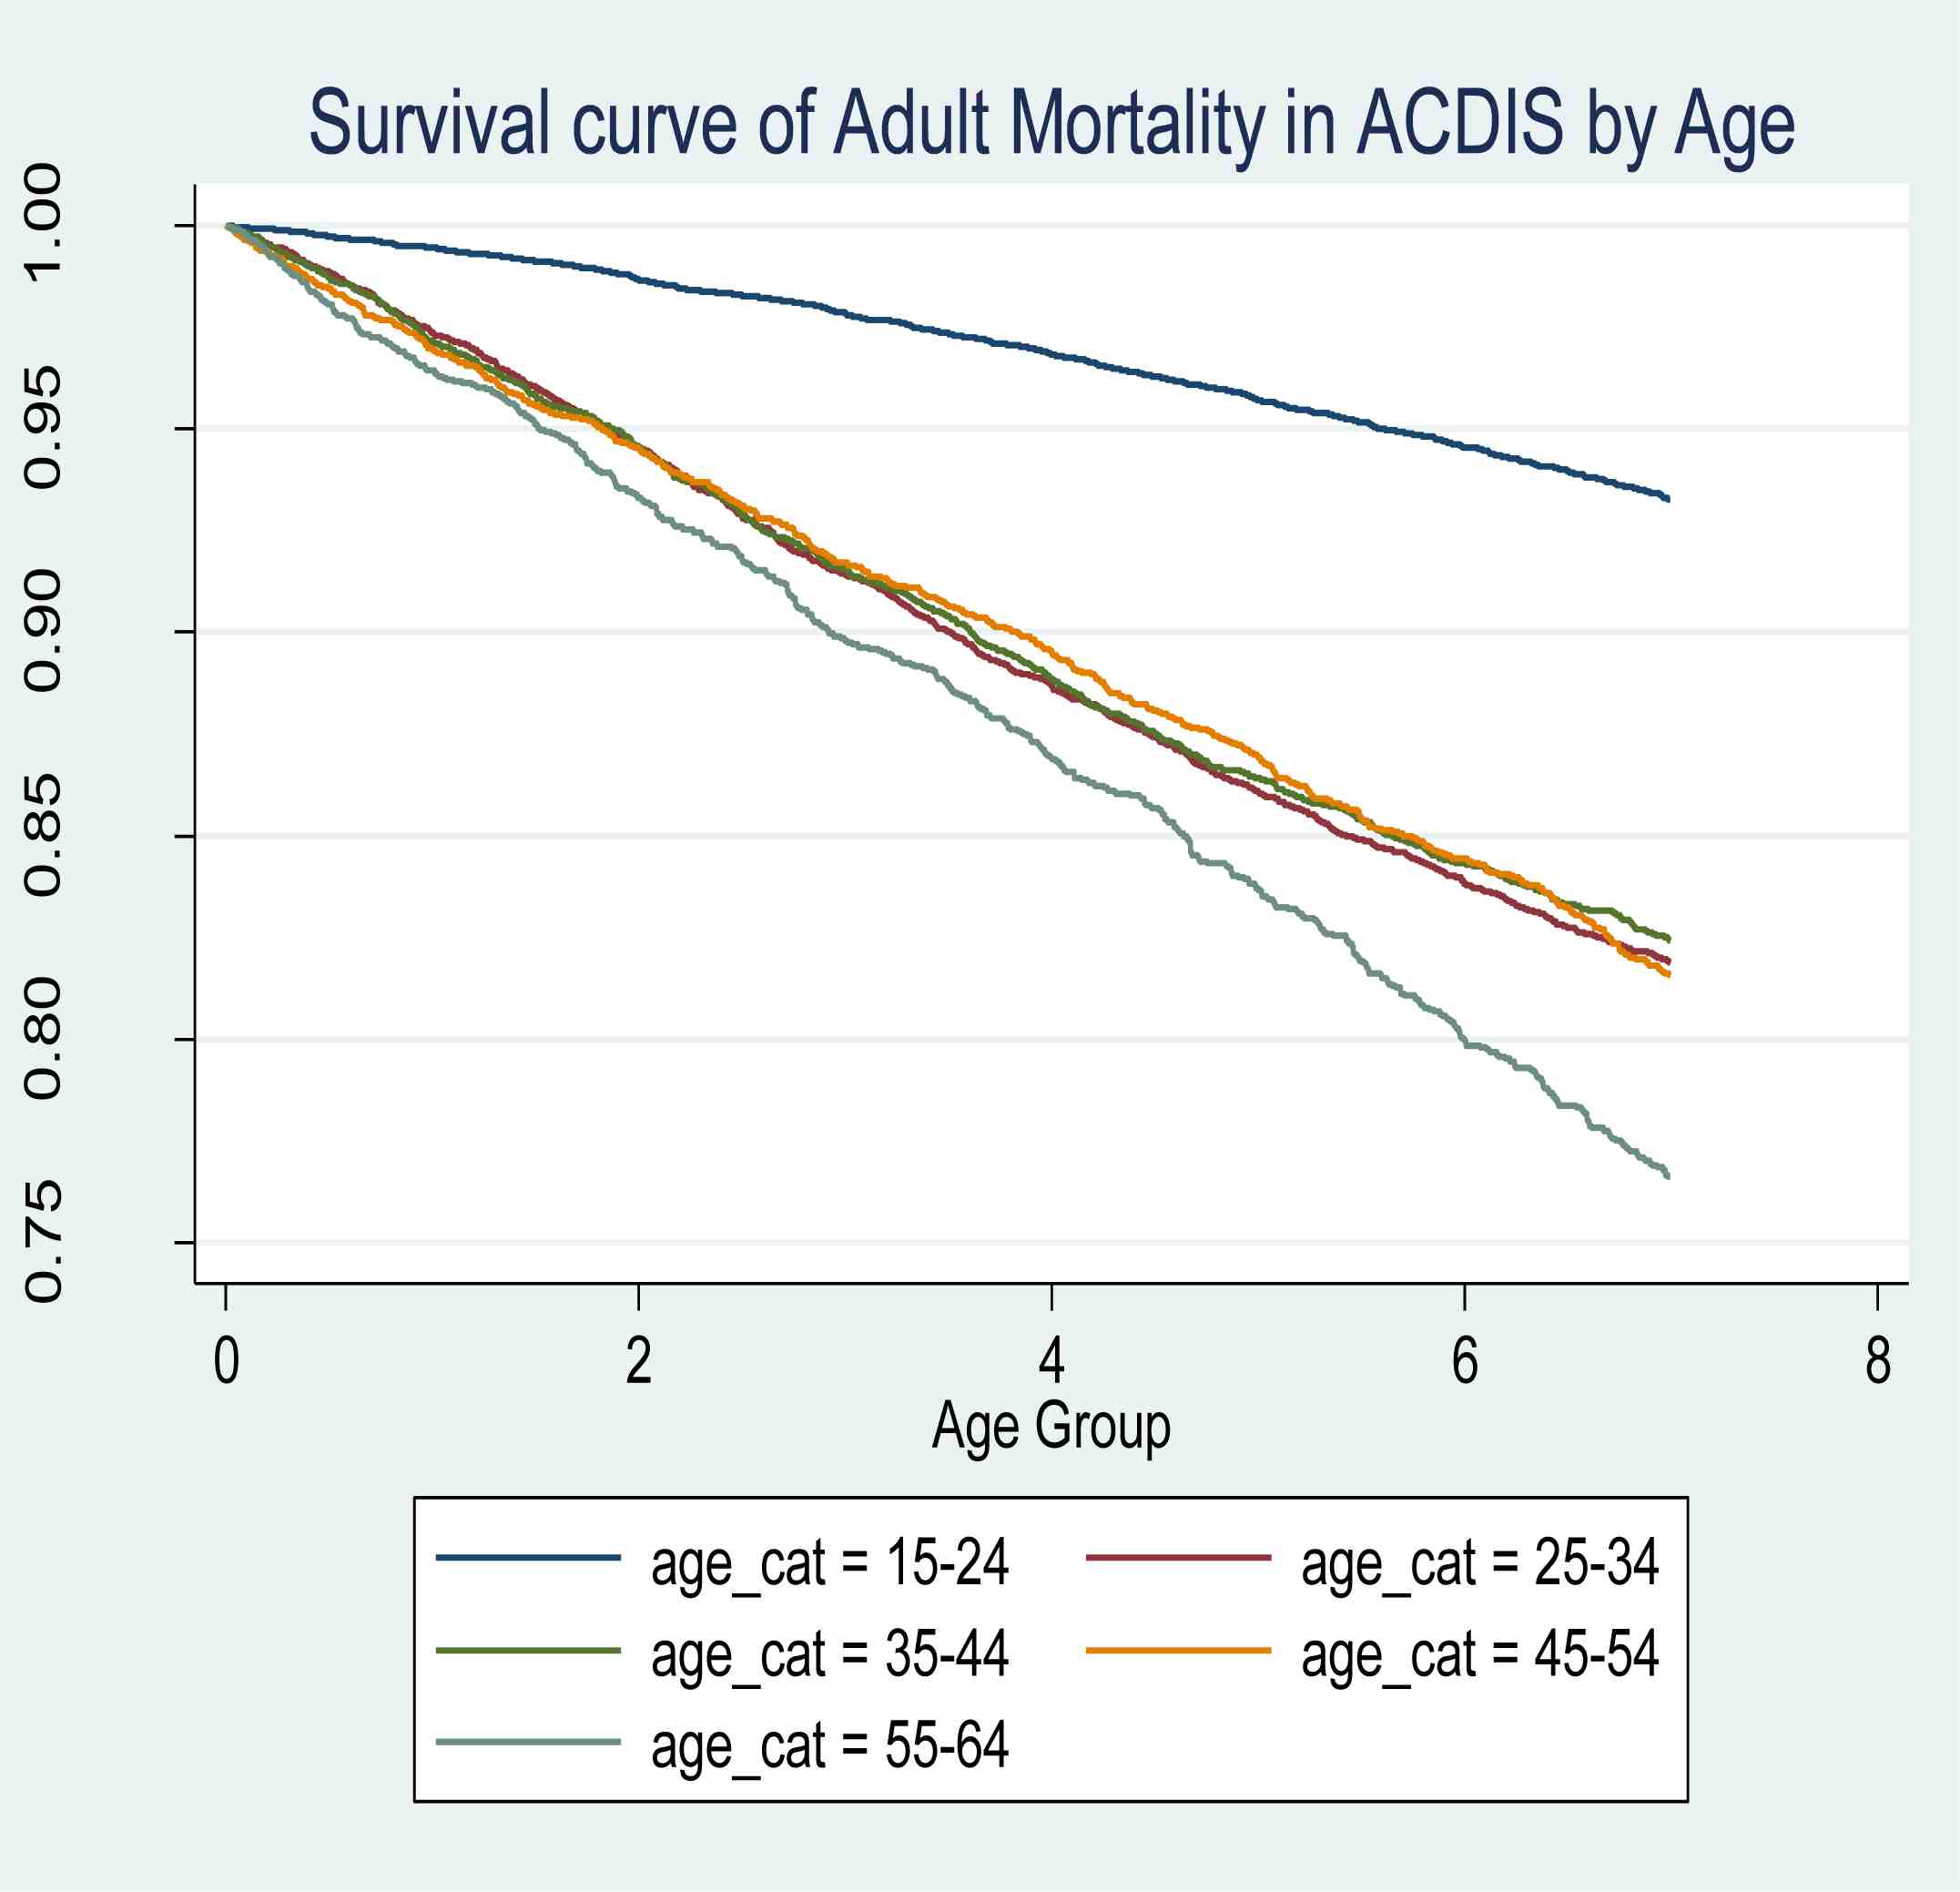
Figure 4: Kaplan-Meir survival curves for adults in the ACDIS.
The univariate analysis or unadjusted hazard model (uaHR) showed no particular trend in association between SES and adult mortality. Adults in the low SES category were 0.04 times less likely to die compared to adults in the lowest group (uaHR=0.96; p=0.492; 95% CI [0.87 - 1.07]). While, adults in the poor category were 0.12 times less likely to die compared to adults in the lowest group (uaHR=0.88; p=0.016; 95% CI [0.79 - 0.97]). Furthermore, adults in the high SES group were 1.01 times more likely to die compared to adults in the lowest SES group (uaHR=1.01; p=0.800; 95% CI [0.91 - 1.11]). During the first period, adults in the highest SES group were 0.10 times less likely to die compared to lowest group (uaHR=0.90; p=0.042; 95% CI [0.81 - 0.99]).
Using the multivariate analysis; adjusting for the potential confounders such as age, education and marital status, the multivariate proportional hazard model showed that in the low SES category, adults were 0.03 times less likely to die compared to the lowest group, but this was not significant (aHR=0.97; p=0.662; 95% CI [0.87 - 1.08]). In the middle SES group, adults were 0.06 times less likely to die compared to the lowest SES group, but the hazard was also not significant (aHR=0.94; p=0.279; 95% CI [0.84 - 1.05]). And in the highest category, adults were 1.09 times more likely to die (aHR=1.09; p=0.128; 95% CI [0.97- 1.22]), but this higher risk was also not significant. The proportional hazard model rule was investigated and found that the model did not violate the rule with a global test of p=0.3335. (Table 3)
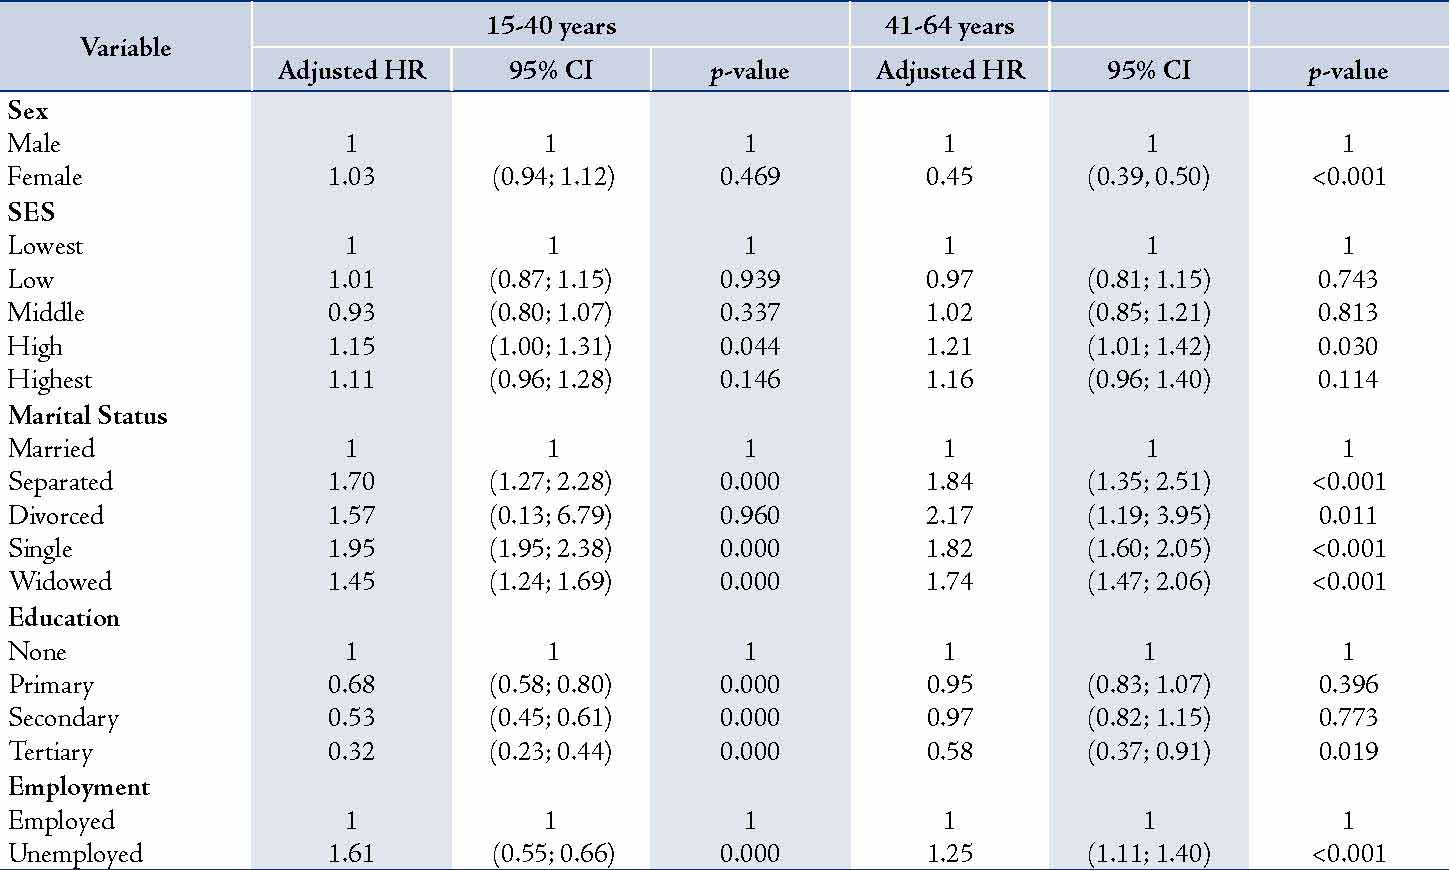
Stratifying the analysis into two main age categories, 15-40 yrs and 41-64 yrs, (Table 4) it was apparent that SES showed a significantly higher hazard ratio in the higher SES categories in both age groups, but the ratios were a little higher among the older adults. In the low SES quintile, adults in the lower age group were 1.01 times more likely to die (aHR=1.01; p=0.939; 95%CI [0.87 - 1.15]), whereas the older adults in the same SES category were 0.03 times less likely to die (aHR=0.97; p=0.743; 95% CI [0.81 - 1.15]).
In the middle poor category, the young adults were 0.07 times less likely to die [aHR=0.93; p=0.337; 95% CI [0.80 - 1.07]), whereas the older adults in the same SES quintile were 1.02 times more likely to die (aHR=1.02; p=0.813; 95% CI [0.85 - 1.21]). Among the high SES group, the younger adults showed a significant 1.15 times more hazard for death (aHR=1.15; p=0.044; 95% CI [1.00 - 1.31]), whilst the older adults were 1.21 times more likely to die (aHR=1.21; p=0.030; 95% CI [1.01 - 1.42]), which was also significant.
In the highest SES quintile, younger adults were 1.11 times more likely to die compared with their counterparts in the lowest SES category (aHR=1.11; p=0.146; 95% CI [0.96 - 1.28]); but again the older adults had a highly increased hazard for death, which was 1.16 times greater (aHR=1.16; p=0.114; 95% CI [0.96 - 1.40]). The proportional hazard rule was again investigated and both models did not violate the rule with a global test of p=0.3907 for the model of the younger age group (15-40 years) and p=0.1436 for the model with the older age groups.
Table 3: Multivariate Cox Model for adult mortality in ACDSA.
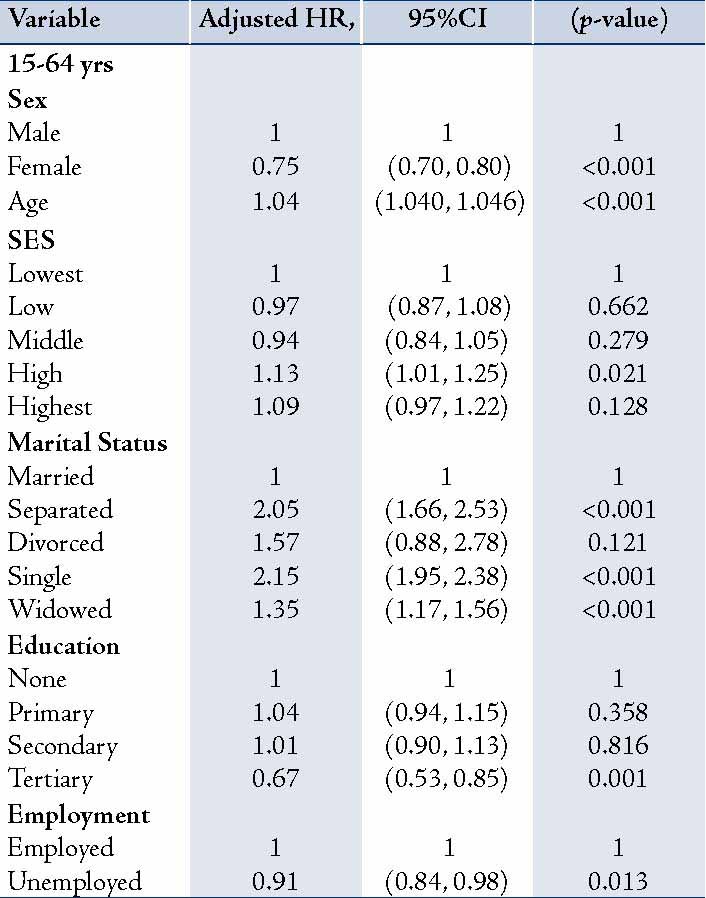
Table 4: Stratified Multivariate Cox Model for adults in ACDSA by two age groups.
Discussion
This study attempted to longitudinally determine adult mortality over a seven year follow-up period and examine its association with socioeconomic status. The overall mortality rate within the seven year follow-up period was 20.8 per 1000 PYO. Among the SES groups, the rates were high for the lowest SES groups (22 per 1000 PYO), and slightly lower for the Highest groups (19.7 per 1000 PYO). The rates recorded showed significant differences between males and females. Males generally had higher rates compared to females. The rate for the males was 23 per 1000 PYO, and 18 per 1000 PYO for the females.
While earlier studies have noted some association between SES and mortality in almost all age groups, the results of this study indicate that the observed association between SES and adult mortality does exist. This finding however, shows no consistent direction of the association with regard to changing levels of SES. There was no statistically significant association between SES and adult mortality. However, there was one exception in the fourth level of SES, but this was not of much prominence, especially when the three other SES quintiles were insignificant.
Socioeconomic status, when adjusted with other variables showed that the hazard of death was marginally higher for all SES groups and the fourth SES quintile remained statistically significant. This change in the observed protective nature of SES shows that SES on its own could not be a variable that determines adult mortality within a homogenous community like Hlabisa district of KwaZulu-Natal.
After adjusting for the confounders, the hazard of death among adult females in the district was observed to be 25% less when compared to adult males. This is consistent with much of the literature that has indicated sex differences in health and mortality with higher mortality for males than females.14 Though women often live longer than males; women on the other hand, are also more likely to acquire chronic diseases and be in a state of ill health for longer periods of time than males.7,15 The death hazard observed among the different age groups showed dramatic increases in hazard with increasing age. The hazard of death generally increased by 4% with every one year increased in age. Age is a well-known factor that explains health and mortality. Its biological dimension is that as adults grow older, their body cells tend to weaken and suffer functional difficulties,15,16 thus becoming more prone to ill health and disease, which often turn to chronic. Mortality has also been identified to increase exponentially with age going up to approximately 10% for each additional year of age.17 Marital status was also found to predict adult mortality. Single adults were observed to be on average twice more likely to die compared to married adults (115% more). Adults who were on the other hand divorced exhibited 57% more likelihood to die compared to those who were married. Whereas, adults whose spouses have died had a 35% more risk of death compared with adults who are married. Similar results have been noted elsewhere in Bulgaria, Finland and the US.18
Though this study found no association between SES and adult mortality, SES still remains an important factor for investigation in understanding adult mortality in South Africa. Social and economic research conducted in South Africa shows that socioeconomic inequalities still exist in the country, making access to social services very difficult, especially among the black population.13 South African policymakers face a great task to substantially reduce the apartheid legacy of high inequality and poverty. The debate about the success and failure of the inequality reduction program in the country is still ongoing, with contrasting conclusions as to whether job creation or jobless growth has taken place in the South African economy.
Our findings should be taken with caution so that SES is not completely ignored in tackling adult mortality, considering the socio-cultural environment of the study population. For instance, one confounding factor that this study found quite important in tackling adult mortality with respect to the study population is marriage, which proved to have a significantly reduced effect on adult mortality among the study population.
There is so much more to be done in order to bridge the socioeconomic inequality gap to in turn increase healthy years of life in South African adults. The major move is to curb the high rates of HIV/ AIDS infections to avoid its consequent deaths. There is need to enhance healthcare utilization among the poor by making healthcare readily available and more affordable. This can be done through a public based health insurance system, fee waivers for sections of the adult population, or provision of healthcare vouchers for particularly economically deprived adults. Accessibility of healthcare and health education by the poor through the provision of health facilities within accessible range would also be very important in reducing the travel distance. This will help eliminate the travel time and cost to health facilities in especially deprived rural settings like Hlabisa district.19
In terms of study limitations; there have been debates about the use of household assets in measuring SES. One of the study limitations is that household assets were a measure of long-term household wealth and did not account for short-term interruptions in the measure. Secondly, the asset component used in measuring SES did not consider the importance that the study population attached to each of the components. Thus, the most useful components that capture the wealth differences in the study population might not have been given the full chance to bring out the needed measure of household wealth differences.
Thirdly, the study was carried out on the assumption that the independent variables were time invariant and thus, they were not treated as time varying covariates; the covariates used were those measured at the start date of the study i.e., 1st January 2001. Variables such as age, marital status and education are however time varying, whose nature might have caused some slight measurement inaccuracies in this study. One other limitation of this study was the inability to control for potential confounds between HIV status and socioeconomic status. This in a way weakens our analysis because in an area with high levels of HIV/AIDS, it is rather meaningless to assess the impact of socioeconomic status on mortality without taking into account the potential confounding health status.
The use of PCA in constructing SES seems not to have been sensitive to differences in socioeconomic status in the Hlabisa district; and therefore, might not have been sufficient in determining adult mortality. Other methods in generating SES could be useful in making the measure of the association between SES and adult mortality more robust.20,21
In rural populations like the Hlabisa district of KwaZulu-Natal, the measure of SES is mainly based on household asset ownerships since it is more difficult to collect expenditure and income variables. However, because in rural populations there exists some homogeneity in the asset ownership, there is need to understand how rural communities attached importance to each asset component to help determine which components are most useful to include in constructing the PCA. This might hopefully reveal a better association between SES and adult mortality, once the most important components are used in the PCA.
Whereas, the first strength of the study is that it was a prospective cohort study, which was measured longitudinally over a period of seven years. The long duration (7 years) of follow-up to the observed event (death) makes the measurements in the study quite reliable and the measured association fairly predictive.
The use of PCA also eliminates most of the measurement problems associated with measuring income and expenditure such as recall bias, seasonality (of income acquisition and expenditures) and data collection time. Another advantage of PCA is that it is fairly easier for computations and in the absence of income or consumption data in rural KwaZulu-Natal, PCA was most useful. It also makes use of all the SES variables in reducing the dimensionality of the data.
Conclusion
This study leads to the conclusion that adult socioeconomic status is not significantly associated with adult mortality in a homogenous community. Bridging the SES gap between the rich and the poor, though a good MDG goal; might therefore not be the only effective way to tackle adult mortality. This finding notwithstanding, there would be need to still combine SES with other factors in reducing adult mortality considering its inseparable link with the other factors. Public health provision, as well as educational measures that can help encourage marriage, as well as healthy lifestyle would be most useful in addressing adult mortality in such rural areas.
Acknowledgements
The authors reported no conflict of interest and no funding was received for this work. Authors also acknowledge that this is an extract from a thesis held by the University of the Witwatersrand, Johannesburg, South Africa. Contributions of all the anonymous reviewers are appreciated.
References
1. Ngom P, Clark S. (2003). "New Life Tables for sub-Saharan African Countries." Paper at Annual Meeting of the Population Association of America sponsored by Population Association of America, Minneapolis, May 1-3, 2003.
2. Statistics South Africa, (2005). Mortality and causes of death in South Africa, 1997-2003: Findings from death notification. Statistical Release, P0309.3.
3. Statistics South Africa. (2008). Mortality and causes of death in South Africa 2006: Findings from death Notification. http://www.statssa.gov.za/publications/. Accessed on May 25, 2012.
4. Preston SH. The changing relation between mortality and level of economic development. Popul Stud (Camb) 1975 Jul;29(2):231-248.
5. Bassuk SS, Berkman LF, Amick BC III. Socioeconomic status and mortality among the elderly: findings from four US communities. Am J Epidemiol 2002 Mar;155(6):520-533.
6. Rogers GR, Hummer AR, Krueger MP. (2005) "Adult Mortality," in Handbook of Population, L. P. Dudley & M. Michael, eds., Kluwer Academic/Plenum Publisher, New York, pp. 283-309.
7. Sternfeld B, Ngo L, Satariano WA, Tager IB. Associations of body composition with physical performance and self-reported functional limitation in elderly men and women. Am J Epidemiol 2002 Jul;156(2):110-121.
8. Filmer D, Pritchett LH. Estimating wealth effects without expenditure data–or tears: an application to educational enrollments in states of India. Demography 2001 Feb;38(1):115-132.
9. Seema V, Lilani K. Constructing socio-economic status indices; how to use principal components analysis. Oxford university press, London, 2006; 459-468.
10. Jakovljević D, Sarti C, Sivenius J, Torppa J, Mähönen M, Immonen-Räihä P, et al. Socioeconomic differences in the incidence, mortality and prognosis of intracerebral hemorrhage in Finnish Adult Population. The FINMONICA Stroke Register. Neuroepidemiology 2001 May;20(2):85-90.
11. McKenzie DJ. (2003) Measure inequality with asset indicators. BREAD Working Paper No. 042. Cambridge, MA: Bureau for Research and Economic Analysis of Development, Center for International Development; Harvard University.
12. Montgomery MR, Gragnolati M, Burke KA, Paredes E. Measuring living standards with proxy variables. Demography 2000 May;37(2):155-174.
13. DPRU. (2007). The Impact of Growth and Redistribution on Poverty and Inequality in South Africa. Development Policy Research Unit DPRU, Working Paper No. 07/126.
14. Case A, Paxson C. Sex differences in morbidity and mortality. Demography 2005 May;42(2):189-214.
15. Grundy E, Sloggett A. Health inequalities in the older population: the role of personal capital, social resources and socio-economic circumstances. Soc Sci Med 2003 Mar;56(5):935-947.
16. Kaplan RM, Kronick RG. Marital status and longevity in the United States population. J Epidemiol Community Health 2006 Sep;60(9):760-765.
17. Oladeinde BH, Omoregie R, Odia I, Oladeinde OB. Prevalence of Malaria and Anemia among Pregnant Women Attending a Traditional Birth Home in Benin City, Nigeria. Oman Med J 2012 May;27(3):232-236.
18. Kohler IV, Martikainen P, Smith KP, Elo IT. Educational differences in all-cause mortality by marital status - Evidence from Bulgaria, Finland and the United States. Demogr Res 2008;19(10):2011-2042.
19. Al-Riyami A. Health researchers and policy makers: a need to strengthen relationship. Oman Med J 2010 Oct;25(4):251-252.
20. Cortinovis I, Vella V, Ndiku J. Construction of a socio-economic index to facilitate analysis of health data in developing countries. Soc Sci Med 1993 Apr;36(8):1087-1097.
21. Clarke R. (2006). Measuring wealth across seven Thai communities. Working paper 17 ESRC Research Group on Wellbeing in Developing Countries, University of Bath. Bath, UK.
22. Lopez AD, Mathers CD, Ezzati M, Jamison DT, Murray CJ. Global and regional burden of disease and risk factors, 2001: systematic analysis of population health data. Lancet 2006 May;367(9524):1747-1757.
|