| |
Abstract
Optical Coherence Tomography (OCT) is a success story of scientific and technological co-operation between a physicist and a clinician. The concept of cross-sectional imaging revolutionalized the applicability of OCT in the medical profession. OCT is a non-contact, topographic, biomicroscopic device that provides high resolution, cross-sectional digital images of live biological tissues in vivo and in real time. OCT is based on the property of tissues to reflect and backscatter light involving low-coherence interferometry. The spatial resolution of as little as 3 microns or even less has allowed us to study tissues almost at a cellular level. Overall, OCT is an invaluable adjunct in the diagnosis and follow up of many diseases of both anterior and posterior segments of the eye, primarily or secondary to systemic diseases. The digitalization and advanced software has made it possible to store and retrieve huge patient data for patient services, clinical applications and academic research. OCT has revolutionized the sensitivity and specificity of diagnosis, follow up and response to treatment in almost all fields of clinical practice involving primary ocular pathologies and secondary ocular manifestations in systemic diseases like diabetes mellitus, hypertension, vascular and neurological diseases, thus benefitting non-ophthalmologists as well. Systemically, OCT is proving to be a helpful tool in substantiating early diagnosis in diseases like multiple sclerosis and drug induced retinopathies by detecting early changes in morphology of the retinal nerve fiber layer.
Keywords: Optical Coherence Tomography; Biomicroscopy; Interferometry.
Introduction
Optical coherence tomography (OCT) was first reported in 1991, as a non-invasive ocular imaging technology.1 It generates a false-color representation of the tissue structures, based on the intensity of the returned light. Over the years, the clinical applications of OCT have dramatically improved in sensitivity and specificity. It has been compared to in vivo optical biopsy. As the resolution of OCT has been getting more and more refined; the identification, detection, localization and quantification of the tissues has accordingly, become more superior and reliable. The OCT scan printout bears a pseudo-color imaging and retinal mapping is based on different color codes (white, red, orange, yellow, green, blue, and black in order); white being the thickest (>470 microns) and black being the thinnest (<150 microns).2 The color code distribution is given in Fig. 1.
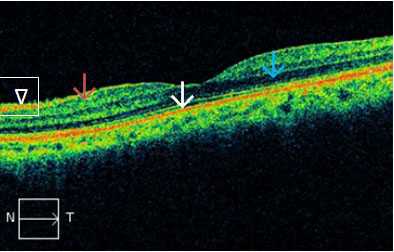
Figure 1: Color codes: Red - High reflectivity (white arrow); black– low reflectivity (blue arrow); green - intermediate reflectivity (magenta arrow). Normal retinal structures are labeled as: red for RNFL (arrowhead) and junction of inner and outer segments of photoreceptors (PR); green for plexiform layers (magenta arrow), and blue/black for nuclear layers (blue arrow). N: Nasal. T:Temporal.
Normal retinal structures are labeled as: red for RNFL, and junction of inner and outer segments of photoreceptors (PR); green for plexiform layers, and blue/black for nuclear layers. Both PR junctions and retinal pigment epithelium (RPE) are represented by red lines, the former is thinner and the latter is thicker. It is not possible to identify the laterality of the eye from the macular scans. This should always be checked with fundus video image of the scan. Light rays from OCT can reasonably penetrate mild ocular media opacities like cataract, posterior capsular opacification, vitreous hemorrhage, asteroid hyalosis and vitritis.
Indications
Optical coherence tomography provides both qualitative (morphology and reflectivity) and quantitative (thickness, mapping and volume) analyses of the examined tissues in-situ and in real time. The indications of OCT include posterior segment lesions like the detection of fluid within the retinal layers or under the retina (which may not be visible clinically),3 macular holes, pseudoholes, epiretinal membranes (ERMs), vitreo-macular adhesion (VMA), vitreo-macular traction (VMT), retinoschisis, retinal detachment, diabetic retinopathy (DR), age-related macular degeneration (ARMD), retinal nerve fiber layer thickness (RNFLT), optic disc parameters, as well as assessment and analysis of anterior segment structures like anterior chamber area, volume and iris thickness. OCT cannot be and should not be interpreted independently in reference to any ocular disease. Also, it should never be taken as the only criteria for the diagnosis or treatment of any ocular pathology. The clinician must have other information available such as valid perspectives of patients’ systemic and ocular disease, fluorescein angiography (FA), indocyanine green angiography (ICGA), biomicroscopy; and above all, the relevant history of the disease process.
Reflectivity
The normal ocular tissues which show high reflectivity are: a) the retinal nerve fiber layer; b) the internal limiting membrane; c) the junction between the inner and outer segments of PRs, probably due to densely stacked disc membranes in the outer segments;4 and d) retinal pigment epithelium-Bruch’s membrane-choriocapillaries complex. High reflectivity is also a feature of reduced retinal thickness (as in retinal atrophy) and scar tissue. Lesions showing high reflectivity may be superficial, intraretinal or deep retinal.
The superficial lesions include; epiretinal and vitreal membranes, exudates and hemorrhages (Fig. 2), and cotton wool spots (Fig. 2), which are exudates at the margin of ischemic areas. While the intraretinal lesions include; hemorrhages, hard exudates (these are lipoproteins located at the margin between healthy and edematous retina), and retinal fibrosis and disciform degenerative scars. On the other hand, the deep lesions include; a) Drusen, b) retinal pigment epithelial hyperplasia, c) intraretinal and subretinal neovascular membranes, d) scarring following choroiditis, e) trauma or laser treatment, and f) hyperpigmented choroidal nevi. The lesions causing hypo or low reflectivity include: a) atrophic RPE (loss of pigment); b) cystic or pseudocystic areas containing serous fluid (Fig. 3); and c) cystoid edema, serous neural retinal detachment and RPE detachment. Such lesions appear as black, optically empty spaces.
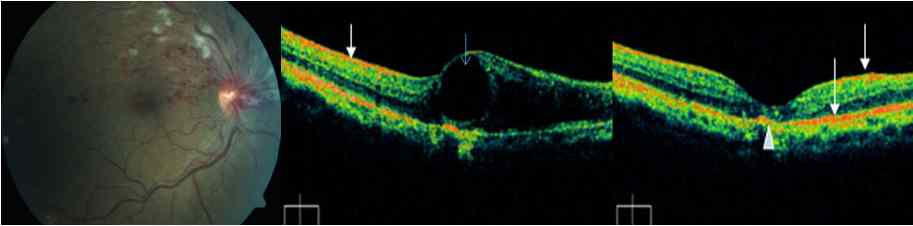
Figure 2: Superior hemi-central retinal venous occlusion. Fundus photo shows classical superficial and deep retinal hemorrhages withcotton wool exudates. Middle: OCT image shows a large cystic swelling of the retina (blue arrow). White arrow indicates signal fromretinal hemorrhage. Right: OCT image of the same eye after intravitreal injections of bevacizumab, showing markedly resolved edema withresidual subfoveal scarring (white arrow head).
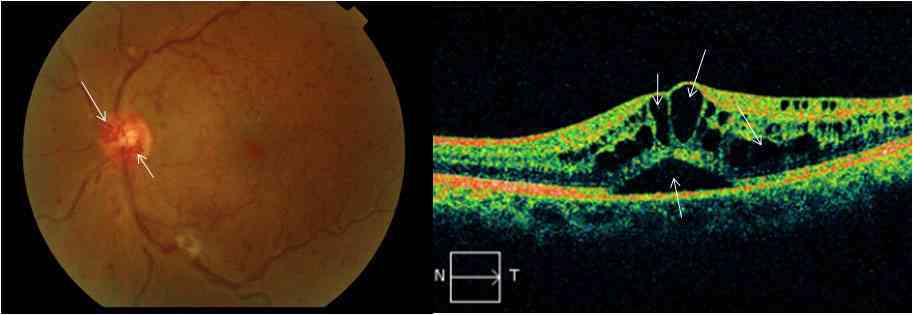
Figure 3: Central retinal venous occlusion- color fundus photo shows collateral blood vessels on the optic disc (white arrows), venous engorgement and diffuse retinal hemorrhages. OCT image shows cystic spaces in the retina (white arrows) indicating retinal edema. Lower arrow indicates serous retinal detachment.
Ocular applications of OCT
These are broadly divided into intraretinal and subretinal collections:
i. Intraretinal fluid collections- These include retinal edema (focal or diffuse), cystoid edema, cysts, microcysts and impending macular holes. OCT provides serial scans which are helpful in quantifying the amount of intraretinal and/or subretinal fluid.
• Retinal edema- The primary cause of retinal thickening is edema. One of the major achievements of OCT has been to evaluate the progression of the pathologic process, and to monitor surgical or non-surgical intervention.5 Retinal edema may present in following forms, individually or in combination:
• Focal or diffuse edema- Common causes of diffuse macular edema include diabetic retinopathy, central retinal venous occlusion (Fig. 3), hemi/branch retinal venous occlusion (Fig. 2), arterial occlusion, hypertensive retinopathy, pre-eclampsia, eclampsia, uveitis, and retinitis pigmentosa. Initially, there may be no or few visible changes. OCT may show reduced reflectivity and increased retinal thickness. Markedly edematous retina has a spongy feature in OCT scans.
• Cystoid macular edema (CME; Fig. 3)- There is intraretinal fluid collection in well defined retinal spaces (outer plexiform layer). The rosette or petalloid appearance is due to the anatomical layout of the outer plexiform layer and the vertical Müller fibers. Common causes of CME include diabetic retinopathy, ARMD, venous occlusions, pars planitis, Uveitis, pseudophakia, Irvine-Gass syndrome, and retinitis pigmentosa. OCT shows diffuse cystic spaces in the outer nuclear layer of central macula, and increased retinal thickness, which is maximally concentric on the fovea, documented as central subfield thickness in OCT printouts.6
• Serous retinal detachment- Occurs sequel to chronic edema. The cysts lose their septae and merge together forming a single or multiple pools of fluid within the retinal layers (Fig. 3), or between the retinal pigment epithelium (RPE) and the sensory retina.7
ii. Subretinal fluid collections
Serous retinal detachment- The classic example is the central serous chorioretinopathy (CSCR). Serous fluid with or without subretinal precipitates causes elevation of the sensory retina (Fig. 3). Biomicroscopically, it resembles a transparent bubble. Fluorescein angiography (FA) shows slow filling of the dye, while OCT reveals an optically empty space with or without cells or exudates (Fig. 4).8 The common causes of CSCR include pregnancy, subretinal neovascularization, optic disc colobomas, diabetic retinopathy, venous occlusions and choroiditis.
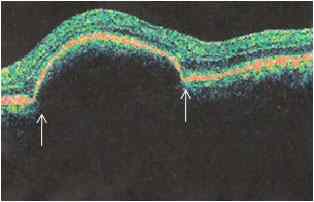
Figure 4: Central serous chorioretinopathy with sub-retinal pigment epithelial fluid (between arrows) in a pregnant patient.
Other applications of OCT in ophthalmology include retinal pigment epithelial detachment, epiretinal membranes (ERM)/Macular pucker (cellophane maculopathy), vitreomacular traction, rhegmatogenous retinal detachment, macular pseudoholes, lamellar holes, full thickness holes, retinoschisis, age related macular degeneration, choroidal neovascular membranes, retinal angiomatosis, and disciform scars / subretinal fibrosis, etc.
OCT in diabetic retinopathy (DR)9,10
Since 2002, OCT has given a tremendous boost to the understanding of DR, its complications and response to various methods of its treatment. This non-invasive technique has revolutionized the evaluation and the prognosis of DR.
Non-proliferative diabetic retinopathy (NPDR) and diabetic macular edema (DME)
Though OCT retinal thickness maps may be better than biomicroscopy alone, one must be cautious not to proceed with laser photocoagulation in DME based solely on OCT findings. Ischemic retina may appear thinner on OCT. It is proper to include clinical examination and FA to guide treatment line in DR. Macular traction is an important association in DME, which does not respond to laser therapy or intravitreal steroids.11 Such eyes have taut posterior hyaloid and show diffuse leakage on FA. OCT is very useful in recognizing this condition with the following findings: a) diffuse cystic retinal thickening; b) flat foveal contour; and c) thickened, hyperreflective vitreoretinal surface.12 In addition, OCT acts as an aid in finding the cause of visual impairment and enables the following analysis in DR:
- Location and extent of retinal edema as a whole and within retinal layers.
- Indications and extent of photocoagulation therapy.
- Monitoring the effectiveness of laser, intravitreal or surgical therapy.
OCT appearance in common pathophysiologic lesions in DR
- Cotton-wool spots- as hyperreflective nodular or elongated lesions in nerve fiber layer, often casting a shadow on posterior layers.
- Hard exudates- appear as hyperreflective formations in deeper retinal layers. Common causes include DR, hypertensive retinopathy, Coats disease, telangiectasias and radiation retinopathy.
- Retinal hemorrhages- hyperreflective scans with shadows on posterior layers.
- Fibrous tissue- appears as a hyperreflective area with deformation of macular outline.
- Retinal edema- seen in OCT scans as thickened and hyporeflective, spongy retina (Fig. 5). The edema is located by retinal mapping and quantified through measurement of retinal thickness and volume. OCT permits better localization of edema than can be done with FA. Over time, microcavities merge to form pseudocysts which are depicted clearly in OCT scans (Fig. 5). Fully developed DME can involve full thickness of the retina with disappearance of retinal tissue, coalescence of the cavities, subsequently leading to a true serous neurosensory retinal detachment (Fig. 5). In such eyes, OCT reveals an optically clear cavity between elevated retina and RPE. One of the real supremacy of OCT in the field of DME from different causes has been to monitor the effectiveness of intravitreal therapeutic drugs (anti vascular endothelium growth factor) in terms of retinal thickness and retinal volume.
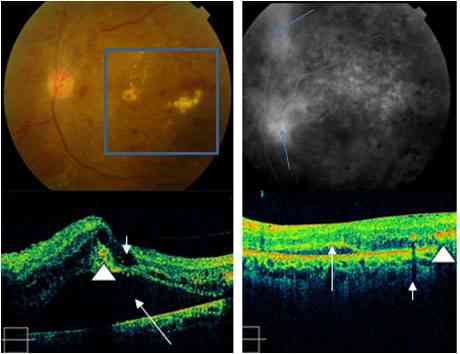
Figure 5: Diabetic retinopathy: Color fundus photo shows hemorrhages, exudates and retinal edema, (within square). FA shows leakage at the disc and superior retina (blue arrows). OCT (lower left) shows intraretinal edema (short arrow), subretinal fluid (long arrow) and hard exudates (arrowhead). Right side OCT image: Eight weeks after intravitreal triamcinolone: minimal residual edema (arrow). Hyperreflective exudates can be seen on right side of the scan (arrowhead).
Proliferative diabetic retinopathy (PDR)
PDR (Fig. 6) occurs commonly in young individuals where newly formed vessels appear at the margin of the ischemic area. Common causes of retinal neovascularization include DR, central retinal vein occlusion (CRVO, Fig. 3), Eale’s disease, vasculitis, pars planitis and sickle cell anemia. Uncommon causes include leukemias and multiple myelomas. The newly formed abnormal blood vessels are thin and fine and are picked up in OCT scans only when glial tissue is present with vessels.
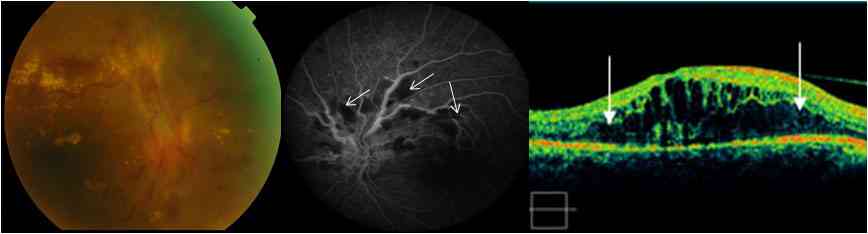
Figure 6: Proliferative diabetic retinopathy: left: Fundus photo shows extensive hard exudates, hemorrhages, noevascularization and glialtissue proliferation. Middle: Fluoresceine angiography shows areas of retinal ischemia (non perfusion-white arrows). Right: OCT imageshows diffuse retinal edema (between arrows).
OCT in retinal venous occlusions exhibit the following features; a) diffuse intraretinal cystic collections causing retinal thickening. Such cysts are evenly distributed throughout the macula,13-15 and b) subretinal fluid. (Figs. 2 and 3)
There are certain rarer conditions that show significant intraretinal cystic spaces in OCT scans, but do not leak on FA. These include X-linked juvenile retinoschisis, Goldman-Favre-vitreoretinal degeneration, nicotinic acid maculopathy, docetaxel (anti-neoplastic drug) toxicity and few variants of vitreomacular traction.16,17
The application of OCT has gone beyond the borders of ophthalmology. Ocular manifestations of systemic diseases are widely accepted as important clues to the diagnosis, treatment and follow up of such disorders. OCT has added a new dimension in this field. Few examples from hematological (Fig. 7) and neurological disorders (Fig. 8) have been cited in this article, but the list is much more extensive.
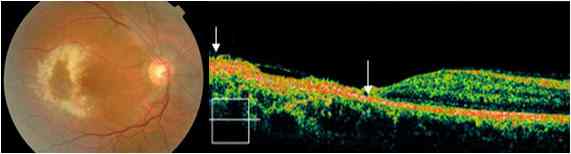
Figure 7: OCT in systemic disease (acute lymphoid leukemia): Fundus photo: ring shaped retinal opacification, with hemorrhages, attributed to leukemic cell infiltration and possible CMV retinitis. OCT shows marked retinal atrophy and a hyperreflective scar (between arrows).
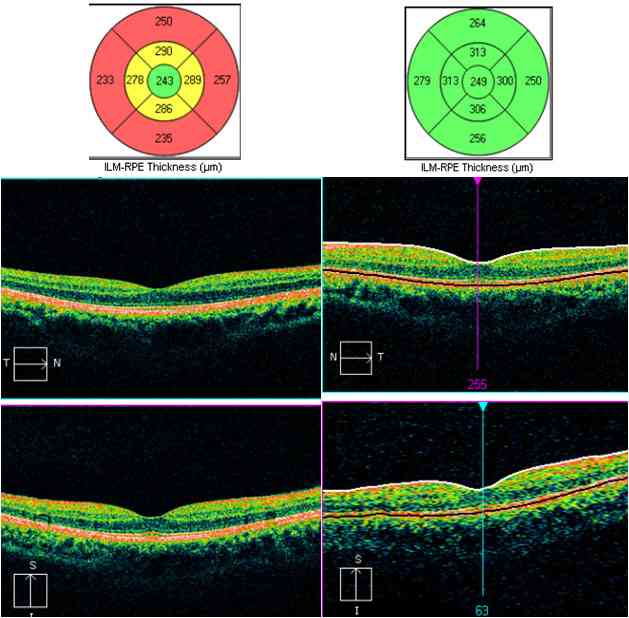
Figure 8: OCT image in a patient with multiple sclerosis. Left image shows overall thinning of retina (depicted by yellow and red codes in upper nomogram). Right image is for comparison showing normal thickness of retina depicted by normal green code in the nomogram.
Clinical applications of optical coherence tomography in systemic diseases
OCT in multiple sclerosis (MS)
The first study to report ocular OCT findings in MS patients was published by Parisi et al.18 Clinicians have been quick to realize the potential use of OCT as an important marker of axonal integrity in MS. As a result, OCT research in MS has grown exponentially in recent years and it has become an undisputed partner into the design of ongoing clinical trials. The disability level in MS is best correlated with axonal damage, but axonal damage is poorly appreciated on MRI. The RNFL is composed primarily of unmyelinated axons that originate from the ganglion cells. In addition to providing an indication of axonal integrity through measurement of RNFL thickness, OCT provides evaluation of the outer macula which is thought to provide an estimate of neuronal integrity within the retina.19,20 OCT measurement of RNFL thickness reflects axonal integrity, while its measurement of total macular volume reflects retinal neuronal integrity. MRI does not provide insight into the process of subclinical optic neuropathy or the subsequent neurodegenerative squeal that ensues in the retina as a result of MS related optic neuropathy. Studies found that the thickness of RNFL was reduced in patients with MS (Fig. 8), and correlated with visual evoked potential P100 amplitude (a reflection of axonal integrity) than with P100 latency (a reflection of myelin integrity), supporting the notion that RNFL thinning in MS is attributed to axonal degeneration, and this in turn reflects the degree of brain atrophy.21 OCT imaging following acute inflammatory optic neuritis has shown that approximately 75% of patients ultimately sustain 10-40 micron reduction in RNFL thickness in the affected eye within 3-6 months, indicating significant and rapid axonal degeneration secondary to demyelination. OCT has documented RNFL thickness 75 microns as a threshold value, below which, there is a reduction in visual function. This observation has been confirmed with automated perimetry testing.22
Based on the correlating findings of OCT, it appears that individuals with progressive MS variants suffer greater RNFL thinning than those with relapsing-remitting variants.23 Pathological specificity of OCT RNFL measurements correlates with histological measurements in primate and human studies and yields good structure-function correlation between RNFL thickness and low-contrast visual acuity.23,24
Future strategy
Adaptive optics in combination with spectral domain-optical coherence tomography (SD-OCT) is going to be a new high-definition, three-dimensional retinal microstructural imaging technology in coming years. OCT derived pachymetry to capture focal thinning in keratoconus is being developed. Coming up are OCT-guided femtosecond laser capsulotomies in cataract surgeries where accuracy of the capsulotomy size, shape, and centration has been quantified in porcine and human eyes.25
Conclusion
More precise and infinite high resolution OCT scans may be able to diagnose systemic diseases much earlier, with high sensitivity and specificity through ocular manifestations. Innovations are in progress to include OCT in evaluating inflammatory, traumatic, neoplastic and degenerative ocular and systemic lesions, not only for ophthalmologists but for a spectrum of clinicians.
Acknowledgements
The authors reported no conflict of interest and no funding was received for this work.
References
1. Huang D, Swanson EA, Lin CP, Schuman JS, Stinson WG, Chang W, et al. Optical coherence tomography. Science 1991 Nov;254(5035):1178-1181.
2. Hee MR, Fujimoto JG, Ko T. Interpretation of the optical coherence tomography image. In: Schuman JS, Puliafito CA, Fujimoto JG, eds. Optical coherence tomography of ocular diseases. Thorofare, NJ: SLACK, Inc., 2004; 21-56.
3. Kang SW, Park CY, Ham DI. The correlation between fluorescein angiographic and optical coherence tomographic features in clinically significant diabetic macular edema. Am J Ophthalmol 2004 Feb;137(2):313-322.
4. Hoang QV, Linsenmeier RA, Chung CK, Curcio CA. Photoreceptor inner segments in monkey and human retina: mitochondrial density, optics, and regional variation. Vis Neurosci 2002 Jul-Aug;19(04):395-407.
5. Kang SW, Park CY, Ham DI. The correlation between fluorescein angiographic and optical coherence tomographic features in clinically significant diabetic macular edema. Am J Ophthalmol 2004 Feb;137(2):313-322.
6. Mavrofrides EC, Villate N, Rosenfeld PJ, Puliafito CA. [eds]. Optical coherence tomography of ocular diseases. In: Schuman JS, Puliafito CA, Fujimoto JG [eds]. Optical coherence tomography of ocular diseases. Thorofare, NJ: SLACK, Inc., 2004; 243-343.
7. Villate N, Mavrofrides EC, Davis J. Chorioretinal inflammatory diseases. In: Schuman JS, Puliafito CA, Fujimoto JG, eds. Optical coherence tomography of ocular diseases. Thorofare, NJ: SLACK, Inc., 2004; 371-412.
8. Al-Mujaini A, Wali U, Ganesh A, Montana C. Natural course of central serous chorioretinopathy without subretinal exudates in normal pregnancy. Can J Ophthalmol 2008 Oct;43(5):588-590.
9. Cruz-Villegas V, Flynn HW Jr. Diabetic retinopathy. In: Schuman JS, Puliafito CA, Fujimoto JG, eds. Optical coherence tomography of ocular diseases. Thorofare, NJ: SLACK, Inc., 2004; 157-214.
10. Schaudig UH, Glaefke C, Scholz F, Richard G. Optical coherence tomography for retinal thickness measurement in diabetic patients without clinically significant macular edema. Ophthalmic Surg Lasers 2000 May-Jun;31(3):182-186.
11. Pendergast SD, Hassan TS, Williams GA, Cox MS, Margherio RR, Ferrone PJ, et al. Vitrectomy for diffuse diabetic macular edema associated with a taut premacular posterior hyaloid. Am J Ophthalmol 2000 Aug;130(2):178-186.
12. Kaiser PK, Riemann CD, Sears JE, Lewis H. Macular traction detachment and diabetic macular edema associated with posterior hyaloidal traction. Am J Ophthalmol 2001 Jan;131(1):44-49.
13. Ip M, Kahana A, Altaweel M. Treatment of central retinal vein occlusion with triamcinolone acetonide: an optical coherence tomography study. Semin Ophthalmol 2003 Jun;18(2):67-73.
14. Lerche RC, Schaudig U, Scholz F, Walter A, Richard G. Structural changes of the retina in retinal vein occlusion–imaging and quantification with optical coherence tomography. Ophthalmic Surg Lasers 2001 Jul-Aug;32(4):272-280.
15. Sekiryu T, Yamauchi T, Enaida H, Hara Y, Furuta M. Retina tomography after vitrectomy for macular edema of central retinal vein occlusion. Ophthalmic Surg Lasers 2000 May-Jun;31(3):198-202.
16. Spirn MJ, Warren FA, Guyer DR, Klancnik JM, Spaide RF. Optical coherence tomography findings in nicotinic acid maculopathy. Am J Ophthalmol 2003 Jun;135(6):913-914.
17. Teitelbaum BA, Tresley DJ. Cystic maculopathy with normal capillary permeability secondary to docetaxel. Optom Vis Sci 2003 Apr;80(4):277-279.
18. Parisi V, Manni G, Spadaro M, Colacino G, Restuccia R, Marchi S, et al. Correlation between morphological and functional retinal impairment in multiple sclerosis patients. Invest Ophthalmol Vis Sci 1999 Oct;40(11):2520-2527.
19. Burkholder BM, Osborne B, Loguidice MJ, Bisker E, Frohman TC, Conger A, et al. Macular volume determined by optical coherence tomography as a measure of neuronal loss in multiple sclerosis. Arch Neurol 2009 Nov;66(11):1366-1372.
20. Moura FC, Medeiros FA, Monteiro ML. Evaluation of macular thickness measurements for detection of band atrophy of the optic nerve using optical coherence tomography. Ophthalmology 2007 Jan;114(1):175-181.
21. Gordon-Lipkin E, Chodkowski B, Reich DS, Smith SA, Pulicken M, Balcer LJ, et al. Retinal nerve fiber layer is associated with brain atrophy in multiple sclerosis. Neurology 2007 Oct;69(16):1603-1609.
22. Costello F, Coupland S, Hodge W, Lorello GR, Koroluk J, Pan YI, et al. Quantifying axonal loss after optic neuritis with optical coherence tomography. Ann Neurol 2006 Jun;59(6):963-969.
23. Pulicken M, Gordon-Lipkin E, Balcer LJ, Frohman E, Cutter G, Calabresi PA. Optical coherence tomography and disease subtype in multiple sclerosis. Neurology 2007 Nov;69(22):2085-2092.
24. Fisher JB, Jacobs DA, Markowitz CE, Galetta SL, Volpe NJ, Nano-Schiavi ML, et al. Relation of visual function to retinal nerve fiber layer thickness in multiple sclerosis. Ophthalmology 2006 Feb;113(2):324-332.
25. Friedman NJ, Palanker DV, Schuele G, Andersen D, Marcellino G, Seibel BS, et al. Femtosecond laser capsulotomy. J Cataract Refract Surg 2011 Jul;37(7):1189-1198.
|
|