In Oman, the estimated mid-year population in 2013 was 3 855 206 of which 2 172 002 were Omanis, and 1 683 204 were non-Omanis. The Omani population has a sex ratio of 973 females per 1 000 males. About 14.3% of the population are under 5 years old, and 34.3% are under 15 years old. Only 5.9% of the total Omani population are above the age of 60 years.1
Prostate cancer is the leading cancer in older men. As per the Ministry of Health Oman Cancer Incidence Registry 2013, cancer of prostate is the first most common cancer (in males). The data in 2011 refers to prostate cancer as the most common cancer in men in the UK, accounting for 25% of all new cases of cancer in males; with 35 567 new cases in England and 2 346 new cases in Wales reported.2 Prostate cancer when detected early (organ defined) is potentially curable by radical prostatectomy. Therefore, early detection is important and prostate-specific antigen (PSA) is widely used for this purpose. However, there has been some limitations for the use of PSA including low specificity in determining the presence of prostate cancer and inability to discriminate between clinically significant prostate cancer (Gleason ≥ 7) and indolent cancer. This is especially prominent in the so-called “diagnostic gray-zone”, in patients with total PSA (tPSA)
< 10 µg/L who frequently bear both benign and malignant prostatic conditions. The specificity of tPSA is reported at only 12.8% at a cut-off of 4 µg/L, leading to a large number of false-positive diagnoses, and 75% of prostate biopsies being unnecessary.3 Overdetection and subsequent overtreatment of indolent prostate cancer was estimated as > 50% in the European screening program.2 Several PSA derivatives, including free PSA (fPSA), percentage of free-to-total PSA ratio (%fPSA), PSA density (PSAD), and PSA velocity (PSAV) have made a major improvement in patient selection for prostate biopsy. However, the capability to determine the presence or aggressiveness of prostate cancer before prostate biopsy remains limited.2 Significant efforts have been made to explore new serum markers that can overcome the limitations of PSA.
PSA belongs to the family of kallikrein-related peptidase (KLK), which in turn belongs to the chymotrypsin (S1) family of serine protease. The different forms of PSA are known as (25) pPSA, (24) pPSA, and (22) pPSA, respectively. Most of the PSA (70–90%) in blood exists as an 80–90 kDa complex with alpha-1-antichymotrypsin. Smaller amounts are bound to other protease inhibitors such as alpha-1-proteinase inhibitor, protein C inhibitor, and alpha-2-macroglobulin. About 10–30% of PSA in blood does not attach to protease inhibitors and is known as fPSA. PSA is a single-chain glycoprotein which is produced exclusively by epithelial cells of the acini and ducts of the prostate gland. It possesses chymotrypsin-like and trypsin-like activity.4 Under normal conditions, PSA is produced as a proenzyme (proPSA) by the secretory cells that line the prostate glands (acini) and secreted into the lumen, where the propeptide is removed to generate active PSA, which can then undergo proteolysis to generate inactive unbound fPSA that enters the bloodstream. Alternatively, active PSA can diffuse directly into the circulation where it is rapidly bound by the protease inhibitors.5 Although, it generates less PSA per cell than normal tissue, prostate cancer lacks basal cells, resulting in the disruption of the basement membrane and normal lumen architecture. As a result, the secreted proPSA and several truncated forms have direct access to the circulation resulting in more PSA “leaked” into the blood and a larger fraction of the PSA produced by malignant tissue escapes proteolytic processing (i.e., activation of proPSA to active PSA and degradation of active PSA to inactive PSA).3–5
PSA testing by itself is limited in the screening or detection of early prostate cancer because it is specific for prostatic tissue but not for prostatic cancer. Unfortunately, the overlap of PSA concentrations between benign prostatic hypertrophy (BPH) (including prostatic inflammation or infection) and early prostatic cancer (i.e., organ-confined cancer) is so extensive, particularly with PSA level of 4–10 µg/L, making selecting an optimum cut-off of PSA for the recommendation of a prostatic biopsy almost impossible.6,7 In one report, the clinical sensitivity of PSA was 78% at the typically used cut-off 4.0 µg/L. By lowering the cut-off to 2.8 µg/L, the sensitivity increased to 92%, whereas the specificity decreased from 33% to 23%. However, raising the cut-off to
8 µg/L improves the specificity to 90%.6 Hence, PSA levels are inherently variable thereby affecting the interpretation of any single result.8
Due to the limited specificity of PSA for prostate cancer screening, there is an ongoing search for adjunctive biomarkers. Retrospective studies have suggested that an isoform of proenzyme PSA called [-2]proPSA (p2PSA) may enhance the specificity of PSA-based screening. PSA is initially produced as proPSA, and this form can preferentially leak into the blood stream in men with prostate cancer. One specific isoform of proPSA is [-2]proPSA, which is unbound and potentially higher in men with prostate cancer. In men with PSA levels between 6.0–24.0 µg/L, the [-2]proPSA fraction was found to be significantly higher in men with prostate cancer. The utility of proPSA to fPSA ratio for screening patients with PSA levels between 2.5–4.0 µg/L and between 4.0–10.0 µg/L has been demonstrated. Elevated proPSA to fPSA ratios have also been associated with aggressive pathological features and decreased biochemical disease-free survival after radical prostatectomy. One case-control study from the PRO-PSA Multicentric European Study showed that %p2PSA and prostate health index (phi) are more accurate than tPSA, fPSA, and %fPSA in predicting prostate cancer and cancer aggressiveness in men with a family history of prostate cancer.9
There is no single study for the evaluation of [-2]proPSA and phi as a tumor marker for prostate cancer in Oman or in the surrounding countries. Therefore, there is a strong need to evaluate the usefulness of this marker along with other prostate specific markers (tPSA and fPSA) for prostate cancer diagnosis. The objectives of the study were:
- To evaluate the validity of tPSA at cut-off ≥ 4.0 µg/L compared to prostatic biopsy for the diagnosis of prostate cancer.
- To evaluate the validity of each of tPSA, fPSA, and p2PSA in patients with different tPSA values: 0.0 µg/L to ≤ 40.0 µg/L compared to prostatic biopsy for diagnosis of prostate cancer among the same patient population.
- To evaluate the usefulness of phi calculated from Access Hybritech p2PSA in combination with Hybritech proPSA and fPSA assays using UniCell DxI 600 Access Immunoassay System (Beckman Coulter, USA). We used this multivariate index to aid the determination of the risk of prostate cancer in our cohort with tPSA in the range 0.0 to ≤ 40.0 µg/L compared to prostatic biopsy for diagnosis of prostate cancer among the same patient population.
Methods
We performed an observational, prospective cohort study from 1 February 2014 to 31 August 2015. We included all male patients referred to the Urology Clinics of the two main tertiary care hospitals in Muscat, Oman; Royal Hospital (RH) and Sultan Qaboos University Hospital (SQUH), and who were scheduled for prostate biopsy in their workup management during the study period. Blood specimens (5 mL) from each of these patients were drawn at the same setting in the morning before obtaining the prostatic biopsy. Blood samples were collected using (VACUETTE®; Greiner Bio-One GmbH, Kremsmüster, Austria) and transferred to the laboratory where they were centrifuged immediately to get the sera and were stored -80 oC until analysis. After getting the required number of specimens, analytical measurement of the three prostate-specific markers (tPSA, fPSA, and p2PSA) were done using UniCell DxI 600 Access Immunoassay System (Beckman Coulter, USA). After blood collection, the patients were underwent transrectal ultrasound (TRUS) guided biopsies either by a urologist or radiologist depending on the protocol that is followed by the urology department in each hospital. For this procedure, the clinician concerned usually uses a G 18 × 20 cm (Kimal, UK) needle to take 12 cores; six from each lobe (apex, mid-gland, and base) from both the medial and lateral sides of the prostate. The biopsies were performed in a day care setting. The prostate gland biopsies specimens were placed in specimen containers and immediately sent to the histopathology laboratory. The specimens were processed and examined at each hospital by a skilled consultant histopathologist.
Phi was calculated for each patient using Access Hybritech phi software. The histopathological report of the prostatic biopsy for each patient was obtained from the histopathology laboratory of the concerned hospital along with the clinical and laboratory data through the hospital information system (HIS), “Al Shifa 3 Plus” in RH and “Track Care” in SQUH. Evaluation and comparison between the different prostate-specific markers and prostate biopsy was done using the result of prostate biopsy as the gold method for the comparison and calculation of the validity indicators of these markers. Ethical approval for the study was obtained from the Medical Ethics and Scientific Research Committee at both RH and SQUH. A flowchart for the total number of patients’ included in the study is shown in Figure 1. Of the 171 patients who scheduled to undergo ambulatory prostate biopsy for suspected prostate cancer, only 136 patients’ samples were included in the study. The inclusions criteria were patients > 45 years old with or without a positive digital rectal examination (DRE) with serum tPSA level ≤ 40 µg/L. The exclusion criteria were patients with bacterial prostatitis, patients being treated with finasteride, patients on antibiotics in the three months prior to the biopsy, and those with renal failure. Also, patients who were on aspirin therapy for various reasons were excluded from obtaining the prostatic biopsy because of possible bleeding issues and did not undergo the procedure.
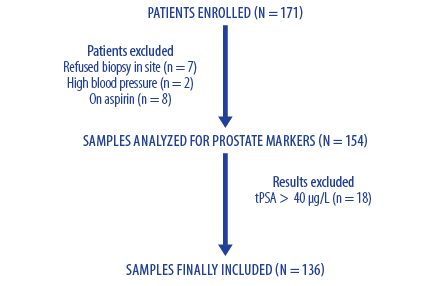
Figure 1: Flowchart of selecting process for patients’ samples included in the study.
The principle of Access Hybritech PSA is a two-site immunoenzymatic (sandwich) assay method. It is a chemiluminescent immunoassay for the quantitative determination of tPSA using the Access Immunoassay System. The same principle is also used to measure Hybritech fPSA and Hybritech p2PSA. Phi is a derived multivariate index, which is intended to aid the determination of prostate cancer risk using the Access Immunoassay System. This is a mathematical formula that combines tPSA, fPSA, and p2PSA values. It is calculated using the following formula: (p2PSA/fPSA) × √PSA. Also, %p2PSA is another derivative of p2PSA that is calculated using the formula: (p2PSA (pg/mL)/(fPSA (µg/L) × 100). This derivative was calculated for each patient, and the results were tabulated and compared with other prostate markers.
Results
The total number of patients included in the study was 136 patients (96 from RH and 40 from SQUH) with an age range of 45–90 years. The clinical presentations of these patients were various signs and symptoms with high PSA level and lower urinary tract signs for which they were scheduled for the TRUS biopsy. The values of the different prostate specific markers and their derived indices in the study patients categorized according to the presence or absence of prostate cancer based on prostate biopsy examination are presented in Table 1. In addition, the association between phi (Hybritech calibration) and the level of Gleason score are presented in Table 2.
Table 1: Clinical and laboratory characteristics of study patients (n = 136). Data are presented as median and range.
|
Age, years |
64.5
(45–82) |
67.0
(48–90) |
66.0
(45–90) |
|
tPSA, µg/L |
13.6
(0.3–40.0) |
6.7
(0.09–44.9) |
7.4
(0.09–44.9) |
|
fPSA, µg/L |
1.4
(0.07–5.81) |
1.4
(0.02–8.07) |
1.4
(0.02–8.07) |
|
%fPSA |
0.1
(0.03–0.43) |
0.2
(0.005–0.5) |
0.2
(0.005–0.5) |
|
p2PSA,
pg/mL |
30.6
(4.0–344.4) |
15.0
(0.6–226.2) |
17.2
(0.6–344.4) |
|
%p2PSA |
0.2
(0.0035–0.98) |
0.1
(0.00001–0.64) |
0.2
(0.00001–0.98) |
tPSA: total PSA; %fPSA: % ratio of fPSA/tPSA; %p2PSA: %p2PSA/fPSA; Phi: prostate health index; PCa: prostate cancer; NEM: no evidence of malignancy.
Table 2: Association between prostate health index (Phi) and Gleason Score in patients with prostate cancer (n = 28).
|
0–19.9 |
0 (0.0) |
0 (0.0) |
|
20–39.9 |
4 (14.2) |
1 (3.5) |
|
40–59.9 |
3 (10.7) |
3 (10.7) |
As shown in Table 1, the total number of patients with positive prostate cancer were 28 (20.5%) based on the gold standard (biopsy histopathology report). Among those with positive prostate cancer, 11 (39.2%) patients had cancer with Gleason score (GS) < 7 as reported by the biopsy report. On the other hand, 17 (60.7%) patients with prostate cancer had GS of ≥ 7. To assign a GS (also called Gleason sum), the pathologist looked at the prostate biopsy sample of the tumor and determined the two most common types of glandular growth patterns. A grade from the scale was given to each of these two patterns, and the two grades added together to get the total GS. For example, if the grade given to the most common growth pattern was 3 and the grade given to the second most common growth pattern was 4, the total GS was 7. The GS is always between 6 and 10. Higher GS indicates more aggressive tumors. Most prostate cancer tumors are low and intermediate grades (6–7). GS below 6 are not usually given because it is difficult for the pathologist to determine with certainty that the lowest grade tumors are cancer.10
The validity indicators (sensitivity, specificity, positive and negative predictive values, and efficiency) were calculated for each marker or index. These indicators were calculated for tPSA at a cut-off value of 4 µg/L, for phi at a cut-off value of 40, and for %p2PSA at a cut-off value of 1.66. In addition, comparison of the validity indicators among all the markers as well as selection of the most appropriate cut-off for each marker based on receiver operation characteristic (ROC) curve was done. This was done to identify the most valid marker and panel as a screening tool for the diagnosis of prostate cancer. All these comparisons and calculations were done based on histology examination.
The validity indicators were calculated from the different prostate markers in the study population.
In practice, a cut-off of tPSA of 4 µg/L is most commonly used to categorize patients. Hence, whether to proceed with further investigations to diagnose prostate cancer or not, particularly if the patient presents with other lower urinary tract symptoms or/and hard nodular gland at DRE that is suggestive of malignant prostate state or/and has a family history of prostate cancer.
Taking into consideration the results as being true positive (TP), false positive (FP), true negative (TN), and false negative (FN) based on histopathology result. The different validity indicators: sensitivity, specificity, positive predictive value (PPV), negative predictive value (NPV), and efficiency are calculated for tPSA at cut-off tPSA value of 4 µg/L as in Table 3.
Table 3: A 2 × 2 contingency table for tPSA at cut-off 4 µg/L.
|
> 4 µg/L |
22 (TP) |
80 (FP) |
102 |
|
≤ 4 µg/L |
6 (FN) |
28 (TN) |
34 |
tPSA: total PSA; TP: true positive; FP: false positive; TN: true negative; FN: false negative.
Accordingly, tPSA has a sensitivity of 78.5% and a specificity of 25.9%, with NPV of 82.3%, which means that this marker could rise in patients with any prostate pathology whether benign or malignant conditions.
A phi value of more than 40 gives the highest probability of the presence of prostate cancer. Hence, in our study the validity indicators of this tool was assessed using a value > 40 as more indicative of a positive result and a value ≥ 40 as more indicative of a negative result.
Accordingly, taking into consideration the TP, FP, TN, and FN, the different validity indicators: sensitivity , specificity, PPV, NPV, and efficiency are calculated for phi at cut-off of 40 in Table 4.
Table 4: A 2 × 2 contingency table for prostate health index (Phi) at cut-off of 40.
|
> 40 |
23 (TP) |
21 (FP) |
44 |
|
≤ 40 |
5 (FN) |
87 (TN) |
92 |
TP: true positive; FP: false positive; TN: true negative; FN: false negative.
Compared to tPSA, phi shows a sensitivity of 82.1% and a specificity of 80.5% with NPV of 94.5% at cut-off value of 40, making it a better marker for prostate cancer detection than tPSA.
According to the literature, %p2PSA is considered a second new tool for prostate cancer diagnosis after the phi. It is the ratio of p2PSA-to-fPSA. It is has been reported that a value of 1.66 is considered to be the best-balanced cut-off between sensitivity and specificity for prostate cancer detection.11 This index was assessed for its validity indicators as compared to the biopsy report at a cut-off value of 1.66.
At %p2PSA results above a cut-off of 1.66, the specificity was 82.4%, which is comparable to that of phi. However; its sensitivity of 64.2% is lower than that for phi although the NPV was 89.8%. This makes the marker a good one for prostate cancer detection [Table 5].
Table 5: A 2 × 2 contingency table for %p2PSA at cut-off of 1.66.
|
≥ 1.66 |
18 (TP) |
19 (FP) |
37 |
|
< 1.66 |
10 (FN) |
89 (TN) |
99 |
%p2PSA: %p2PSA/fPSA; TP: true positive; FP: false positive; TN: true negative; FN: false negative.
ROC curve was obtained on different prostate markers: tPSA, phi, and %p2PSA to yield which markers or panels was the most effective as a screening tool to diagnose prostate cancer. The ROC curves along with their best cut-off value for diagnosis are shown in Figures 2, 3, and 4.
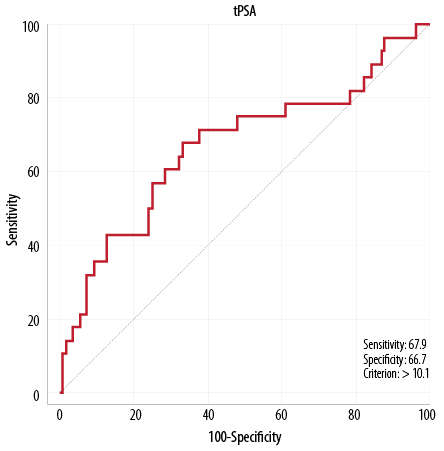
Figure 2: Receiver operation characteristic curve for total prostate-specific antigen (tPSA).
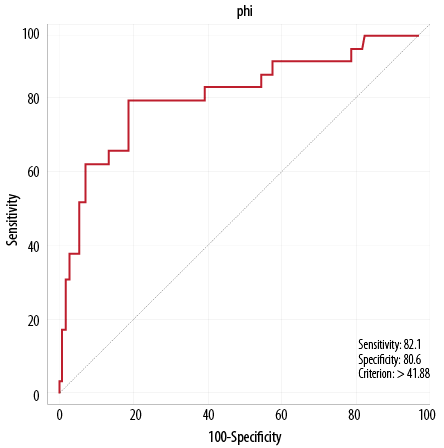
Figure 3: Receiver operation characteristic curve for prostate health index (phi).
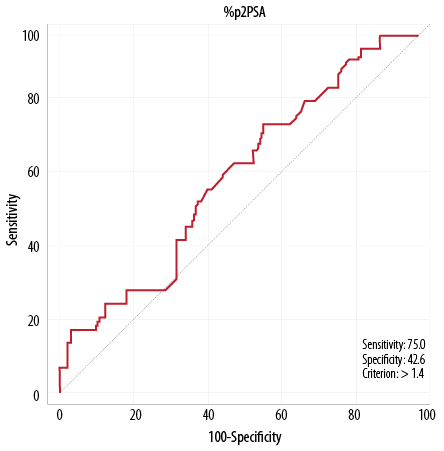
Figure 4: Receiver operation characteristic curve for %p2PSA/fPSA (%p2PSA).
The cut-off thresholds selected for the validity indicators were: 41.9 for phi compared with 40 (as described in the literature), 1.4 for %p2PSA compared with 1.66, and 10 µg/L for tPSA compared with 4.0 µg/L. It appears that phi has the highest area under the curve (AUC), sensitivity and NPV with relatively high specificity and reasonable PVP compared with the other markers. The AUC for phi was 0.81, followed by 0.67 for tPSA, and 0.55 for %p2PSA. In addition, phi has the highest sensitivity of 82.1% followed by 75.0% for %p2PSA and 67.9% for tPSA. In addition, the highest NPV of 94.5% was noticed for phi, followed by 82.4% for tPSA and 89.8% for %p2PSA. The highest specificity was observed for phi (80.6%), followed by tPSA (66.7%) and %p2PSA (42.6%). In addition, for PVP, the highest value was noticed for phi (52.3%), followed by tPSA (34.0%) and %p2PSA (23.1%). Therefore, based on the above results, phi appears to be the best marker for prostate cancer screening.
Discussion
As per PubMed literature search in January 2017, this study is the first reported experience for the use of p2PSA and phi in the workup investigations of men with suspected prostate cancer in Oman, the Gulf Cooperation Council (GCC), the Middle East, and North Africa. The study has shown that phi outperforms tPSA and fPSA, when used alone or in combination, and appears to be more accurate than both markers in excluding prostate cancer before biopsy. Therefore, it helps clinicians to avoid unnecessary biopsies, particularly in patients with gray-zone tPSA level. Phi is the strongest marker that correlates proportionally with GS; making it useful in predicting the aggressiveness of the disease. Because of the limitation of tPSA, other more specific markers, fPSA and p2PSA and their derived indices, particularly phi, have been used in combination with tPSA in the USA and to a lesser extent in Europe and Japan to improve the detection of prostate cancer. In the last few years, there has been increasing interest in the use of these markers in diagnosing men with or without prostate cancer as well as in categorizing those with prostate cancer according to its aggressiveness using GS.2,8,12,13 Currently, p2PSA (including phi) is approved by the European Union for prostate cancer detection and by the Food and Drug Administration (FDA) in the United States since 2012.13 Reports from the National Health Service (NHS) and National Institute of Clinical Excellence (NICE) have confirmed the clinical usefulness of these markers, but not their additional discriminative ability or cost-effectiveness compared to existing laboratory and radiological tools.14,15
Phi, developed by Beckman Coulter, Inc., was introduced as a new marker for improving the clinical sensitivity and specificity in prostate cancer diagnosis particularly for men with borderline raised tPSA levels and DRE not suspicious of the cancerous state. The categories of phi suggested by the manufacturer and supported by many investigators include low-risk (0–19.9), moderate-risk (20–39.9), and high-risk (≥ 40) categories. Our current study examined the clinical usefulness of phi compared with its other components in Omani patients investigated for prostate cancer. Of the 136 patients included who had tPSA in the range 0.0–40.0 µg/L, 28 (20.6%) patients had prostate cancer, as confirmed by prostate biopsy. The study showed a significant stepwise increase in the prostate markers: tPSA, p2PSA, %p2PSA, and phi in patients with prostate cancer compared to patients with benign prostatic conditions. The medians were: 6.7 vs.13.65 µg/L for tPSA, 15 vs. 30.6 pg/mL for p2PSA, 1.58 vs. 2.7 for %p2PSA, and 26.9 vs. 75 for phi in patients with benign prostatic conditions and prostate cancer, respectively. These results are comparable with the results published by several studies. Fuchsova et al.16 in their 263 patients series reported comparable trends in median values of p2PSA (16 vs. 21 pg/ml, phi: 35 vs. 62, tPSA: 7.2 vs. 7.7 μg/L, and %fPSA: 16.7 vs. 11.7% in men without and with prostate cancer, respectively). In addition, De Luca et al,17 reported significantly lower medians phi in men with a negative biopsy compared with those with a positive biopsy (34.9 vs. 48.1; p < 0.001) and %fPSA (11.8% vs. 15.8%; p < 0.020) in their 252 patients series of whom 43 (17.1%) had prostate cancer and 171 (68%) had tPSA 2–10 µg/L. The authors showed a comparable clinical benefit for phi and PCA3 score in diagnosing prostatitis versus prostate cancer; however, phi was the only determinant for prostatitis versus BPH, although both markers could not discriminate prostatic inflammation from high-grade prostate intraepithelial neoplasia.
Our study showed the AUC ROC curve for phi, %p2PSA, and tPSA were 0.81, 0.67, and 0.55, respectively. Phi showed the highest sensitivity of 82.1% (compared with tPSA 78.6% and %p2PSA 64.3%), and highest NPV of 94.6% (compared with %p2PSA 89.9% and tPSA 82.4%,). The highest specificity was observed for %p2PSA of 82.4% followed by phi 80.6%. A lower specificity was noted for tPSA 25.9%. The PPV was not high for almost all markers. Comparable high PPV was noticed for phi (52.3%) and %p2PSA (48.6%). Lower PPV was noted for tPSA (21.6%). Additionally, the highest overall efficiency was noted for both phi (81%), and %p2PSA (79%), and the lowest efficiency was noted for tPSA (36.8%). Modifications to the optimal cut-offs for the different markers, as reflected by the ROC curve, showed optimum markers cut-offs of 41.9 for phi (compared with 40 as described in the literature), 1.4 for %P2PSA (compared with 1.66), and 10 µg/L for tPSA (compared with 4.0 µg/L). At these cut-offs, there is some alteration in the validity of few markers; however, there was no major change in their prioritization as markers for the diagnosis of prostate cancer.
The data obtained in our study are comparable to others published in the literature; phi appears to be the best marker for prostate cancer screening to date followed by %p2PSA. Inclusion of the three markers and model calculation of phi will significantly improve the outcome of the overall marker(s). Boegemann et al,18 in their multicenter study, showed that compared with tPSA and %fPSA, phi and %p2PSA have a superior diagnostic performance for detecting prostate cancer in men with tPSA in the range 1.6–8.0 ng/mL, with AUC 0.73 and 0.70 for all patients, AUC 0.69 and 0.67 at initial, and AUC 0.74 and 0.74 at repeat biopsy for phi and %p2PSA, respectively. In contrast, AUC of 0.59 and 0.54 was noted for %fPSA and tPSA, respectively. They found phi and %p2PSA to be good prostate cancer prediction tools for men aged ≤ 65 years and to be equally superior for counseling patients before biopsy. In addition, Loeb et al,19 evaluated 658 men aged ≥ 50 years with normal DRE and tPSA 4–10 µg/L who underwent a prostate biopsy. They reported significantly higher phi in men with GS ≥ 7 and ‘Epstein significant’ cancer with the highest AUC 0.708, compared with %fPSA 0.648, p2PSA 0.550, and tPSA 0.516. In patients with GS ≥ 7 the AUCs were phi 0.707, %fPSA 0.661, p2PSA 0.558, and tPSA 0.551, and in those with significant prostate cancer the AUCs were phi 0.698, %fPSA 0.654, p2PSA 0.550, and tPSA 0.549.
Throughout the clinical spectrum of patients with suspected prostate cancer, phi outperforms p2PSA, fPSA, and tPSA. Moreover, in the study by Loeb et al,19 at a cut-off for phi of 90% sensitivity (< 28.6), 30% of patients could have been spared prostate biopsy for benign conditions or insignificant prostate cancer compared with 21.7% of patients when using %fPSA.
Furthermore, our study showed an association between phi values and the aggressiveness of prostate malignancy. Of the 28 patients with biopsy-proven prostate cancer, 22 patients had tPSA > 4 µg/L. However, based on phi, no patient had phi in the low-risk category, five patients had phi in the moderate-risk category (four with GS < 7 and one with GS ≥ 7), six patients with phi in the high-risk category (three with GS < 7 and three with GS ≥ 7), and 17 patients with phi in very high-risk category (four with GS < 7 and 13 with GS ≥ 7). Seventeen (60.7%) patients with prostate malignancy had GS ≥ 7, among whom 16 (94% of patients with GS of ≥ 7) had phi ≥ 40. Wang et al,20 in a meta-analysis found significantly higher phi values observed in patients with GS ≥ 7 (phi ≥ 60) compared with GS < 7 (phi 53; p = 0.0018). Hence, the proportion of aggressive prostate cancer (GS ≥ 7) increased with increasing phi, with the higher the phi value, the more likely the tumor to have a higher GS score. This clinically important finding was confirmed by Abrate et al.21 Filella et al,22 reported higher phi (median: 69.75 vs. 48.04) and %p2PSA (median: 2.60 vs. 1.98) values in patients with prostate cancer, that were significantly higher (p < 0.001) in patients with a prostate biopsy with GS ≥ 7.
Our study confirmed the clinical significance of phi in terms of its higher accuracy in prostate cancer diagnosis as well as its ability to predict prostate cancer aggressiveness. Our data supported the promising usefulness of phi as a screening prostate marker that could help clinicians to decide on the need for prostate biopsy. It is hoped that phi use will reduce the number of unnecessary biopsies, and eliminate unnecessary management. Furthermore, phi ability to predict the aggressiveness of the diagnosed prostate cancer was confirmed in our study, which might be of great assistance to the urologist in their workup management of patients with suspected prostate cancer.
Although the majority of studies in the literature limited the use of phi to patients with tPSA in the range 2–10 or 2–20 µg/L, our study involved patients with tPSA in the range 0–40 µg/L. The wider inclusion of tPSA range was followed as our samples’ analysis showed four patients with tPSA < 2 µg/L with positive biopsy-proven prostate cancer. Also, 13 patients had tPSA > 20 µg/L but were negative for prostate cancer. Hence, based on the expected results in our patients series, the target tPSA range was decided to be 0–40 µg/L. However, one patient had tPSA > 40 µg/L with no prostate cancer. In addition, despite reliance on biopsy examination by our histopathology teams as the gold standard for diagnosis and thereafter calculating the validity of the different markers, an element of variation as a possible source of error in missing the correct diseased prostatic part when taking prostate biopsy or misinterpreting the prostatic lesion is still possible and have been reported internationally.23
Conclusion
Our study has proved the usefulness of phi and its component tests in predicting the diagnosis and aggressiveness in men suspected of having prostate cancer. The evidence for its role in improving the accuracy of clinical outcome remains incomplete and the level of evidence for improving this clinical outcome is not very supportive. However, the use of phi outperforms other conventional prostate markers (i.e., tPSA and fPSA) when used alone or in combination for prostate cancer detection. It appears that phi is the marker that has the highest AUC, sensitivity, and NPV with relatively high specificity and reasonable PVP compared with other prostatic markers to exclude prostate cancer before biopsy. This helps clinicians to avoid unnecessary biopsies, particularly in patients with gray-zone tPSA level. This is followed by %fPSA and to a lesser extent by tPSA, which has the lowest validity. Also, phi correlates proportionally with GS and can be used for prostate cancer stratification and in predicting the aggressiveness of the disease. The study is the first experience report for the use of p2PSA and phi in Oman, the Middle East and North Africa which reflects the limited or lack of awareness of these tools in the diagnosis of prostate cancer that is still commonly screened by the other existing markers particularly tPSA, which has low diagnostic validity.
Disclosure
The authors declared no conflicts of interests. Provision of the kits for the measurement of tPSA, fPSA, and p2PSA was supported by a grant from The Research Council (TRC), Oman.
Acknowledgements
Dr Safana Al Saidi conducted this research as a project for fulfilling the requirement of the Fellowship of the Royal College of Pathologists (UK) in Chemical Pathology through a grant from TRC, Oman. The TRC is highly acknowledged for this support. The authors also would like to thank Histopathology Departments for their reports on prostate biopsies at both Hospitals; the Royal Hospital and Sultan Qaboos University Hospital, Muscat, Oman. The authors would also like to thank the Biomedical Scientists Mrs. Fatima Al Aesari and Mrs. Faiza Al Aesari from the Royal Hospital; Mr. Hamed Dhawi Al Riyami and Mr. Ben Fadri Perez for their technical work; Ms. Hameeda Al Barwani and Mr.Khalfan Al Bahri from the Royal Hospital, and Mr. Hussein Al Senaidi from Sultan Qaboos University Hospital for collecting the samples; and the secretary Mrs. Marina Molo Bendecio from Sultan Qaboos University Hospital for her administrative work.
references
- 1. Cancer incidence in Oman, 2013. Dept of Non-Communicable Disease Surveillance and Control, Directorate General of Primary Healthcare, Ministry of Health, Oman [cited: 2017 April]. Available from: http//www.moh.gov.om/en-US/web/general-directorate-of-primary-health-care/resources.
- 2. Cancer Research UK. Prostate Cancer Incidence Statistics. 2014 [cited: 2016 Dec]. Available from: http://www.ons.gov.uk/peoplepopulationandcommunity/healthandsocialcare/conditionsanddiseases/bulletins/cancerregistrationstatisticsengland/previousReleases
- 3. Huang Y-Q, Sun T, Zhong W-D, Wu C-L. Clinical performance of serum [-2]proPSA derivatives, %p2PSA and PHI, in the detection and management of prostate cancer. Am J Clin Exp Urol 2014 Dec;2(4):343-350.
- 4. Mikolajczyk SD, Song Y, Wong JR, Matson RS, Rittenhouse HG. Are multiple markers the future of prostate cancer diagnostics? Clin Biochem 2004 Jul;37(7):519-528.
- 5. Emami N, Diamandis EP. Utility of kallikrein-related peptidases (KLKs) as cancer biomarkers. Clin Chem 2008 Oct;54(10):1600-1607.
- 6. Balk SP, Ko YJ, Bubley GJ. Biology of prostate-specific antigen. J Clin Oncol 2003 Jan;21(2):383-391.
- 7. Smelov V, Novikov A, Brown LJ, Eklund C, Strokova L, Ouburg S, et al. False-positive prostate cancer markers in a man with symptomatic urethral Chlamydia trachomatis infection. Int J STD AIDS 2013 Jun;24(6):501-502.
- 8. Hara N, Koike H, Ogino S, Okuizumi M, Kawaguchi M. Application of serum PSA to identify acute bacterial prostatitis in patients with fever of unknown origin or symptoms of acute pyelonephritis. Prostate 2004 Sep;60(4):282-288.
- 9. Carter HB, Pearson JD, Metter EJ, Brant LJ, Chan DW, Andres R, et al. Longitudinal evaluation of prostate-specific antigen levels in men with and without prostate disease. JAMA 1992 Apr;267(16):2215-2220.
- 10. Gleason classification for prostate cancer [cited: 2016 Dec]. Available from: http://www.cancer.ca/en/cancer-information/cancer-type/prostate/grading/gleason-classification.
- 11. Sokoll LJ, Sanda MG, Feng Z, Kagan J, Mizrahi IA, Broyles DL, et al. A prospective, multicenter, National Cancer Institute Early Detection Research Network study of [-2]proPSA: improving prostate cancer detection and correlating with cancer aggressiveness. Cancer Epidemiol Biomarkers Prev 2010 May;19(5):1193-1200.
- 12. Zhu L, Jäämaa S, Af Hällström TM, Laiho M, Sankila A, Nordling S, et al. PSA forms complexes with α1-antichymotrypsin in prostate. Prostate 2013 Jan;73(2):219-226.
- 13. Sokoll LJ, Sanda MG, Feng Z, Kagan J, Mizrahi IA, Broyles DL, et al. A prospective, multicenter, National Cancer Institute Early Detection Research Network study of [-2]proPSA: improving prostate cancer detection and correlating with cancer aggressiveness. Cancer Epidemiol Biomarkers Prev 2010 May;19(5):1193-1200.
- 14. Sokoll LJ, Chan DW, Klee GG, Roberts WL, van Schaik RH, Arockiasamy DA, et al. Multi-center analytical performance evaluation of the Access Hybritech® p2PSA immunoassay. Clin Chim Acta 2012 Aug;413(15-16):1279-1283.
- 15. Semjonow A, Köpke T, Eltze E, Pepping-Schefers B, Bürgel H, Darte C. Pre-analytical in-vitro stability of [-2]proPSA in blood and serum. Clin Biochem 2010 Jul;43(10-11):926-928.
- 16. Fuchsova R, Topolcan O, Windrichova J, Hora M, Dolejsova O, Pecen L, et al. PHI in the Early Detection of Prostate Cancer. Anticancer Res 2015 Sep;35(9):4855-4857.
- 17. De Luca S, Passera R, Fiori C, Bollito E, Cappia S, Mario Scarpa R, et al. Prostate health index and prostate cancer gene 3 score but not percent-free Prostate Specific Antigen have a predictive role in differentiating histological prostatitis from PCa and other nonneoplastic lesions (BPH and HG-PIN) at repeat biopsy. Urol Oncol 2015 Oct;33(10):424.e17-424.e23.
- 18. Boegemann M, Stephan C, Cammann H, Vincendeau S, Houlgatte A, Jung K, et al. The percentage of prostate-specific antigen (PSA) isoform [-2]proPSA and the Prostate Health Index improve the diagnostic accuracy for clinically relevant prostate cancer at initial and repeat biopsy compared with total PSA and percentage free PSA in men aged ≤65 years. BJU Int 2016 Jan;117(1):72-79.
- 19. Loeb S, Sanda MG, Broyles DL, Shin SS, Bangma CH, Wei JT, et al. The prostate health index selectively identifies clinically significant prostate cancer. J Urol 2015 Apr;193(4):1163-1169.
- 20. Wang W, Wang M, Wang L, Adams TS, Tian Y, Xu J. Diagnostic ability of %p2PSA and prostate health index for aggressive prostate cancer: a meta-analysis. Sci Rep 2014 May;4:5012.
- 21. Abrate A, Lughezzani G, Gadda GM, Lista G, Kinzikeeva E, Fossati N, et al. Clinical use of [-2]proPSA (p2PSA) and its derivatives (%p2PSA and Prostate Health Index) for the detection of prostate cancer: a review of the literature. Korean J Urol 2014 Jul;55(7):436-445.
- 22. Filella X, Foj L, Augé JM, Molina R, Alcover J. Clinical utility of %p2PSA and prostate health index in the detection of prostate cancer. Clin Chem Lab Med 2014 Sep;52(9):1347-1355.
- 23. Veltri RW, Miller MC, O’dowd GJ, Partin AW. Impact of age on total and complexed prostate-specific antigen cutoffs in a contemporary referral series of men with prostate cancer. Urology 2002 Oct;60(4)(Suppl 1):47-52.