Coronary heart disease (CHD), stroke, and peripheral arterial disease (PAD) are the main cardiovascular diseases (CVDs) among populations with type 2 diabetes mellitus (T2DM).1−3 CVD incidence varies considerably across diabetic populations. Cumulative incidence of CVD data from New Zealand and Australia showed that 17.9% and 14.9% of T2DM patients' respectively, developed their first CVD within a five-year mean period of follow-up.4,5 However, data from China showed much lower rate (4.9%) within a similar follow-up period.6 Another population-based study showed the seven-year incidence of CHD among patients with diabetes to be around 20% in Finland.7
Various traditional risk factors such as male gender, age, obesity, dyslipidemia, hypertension (HTN), poor glycemic control (high glycosylated hemoglobin (HbA1c)), albuminuria, smoking, and family history of CVD have been identified to be independent contributors for CVD.8,9 In addition, other non-traditional factors such as social deprivation and erectile dysfunction as well as other hematological factors were studied later and showed significant association with CVD.8,9 However, until now there is no sufficient evidence that monitoring the non-traditional factors leads to better diagnostic and treatment results.8,10
In Oman, the prevalence of T2DM reached 12.3% in 2008.11 Very limited literatures are available relating to CVD occurrence and its risk factors among patients with T2DM in this country. A descriptive study indicated that 54.1% of Omani patients presented for coronary artery bypass surgery were found to be diabetics.12 Another study among Omani patients with T2DM revealed a high prevalence of CVD risk factors (52.2% were hypertensive, 56.7% with uncontrolled glycemia, and 44.1% with hypercholesterolemia) among the study sample.13 Consistent results have been observed in the national health survey in 2008.11 Moreover, other data showed that 42.5% of Omani patients with diabetes were having micro- or macro-albuminuria.14 However, literature review revealed that no CVD incidence studies nor analytic studies addressing CVD risk factors have been conducted among Omanis with T2DM.15
This study aimed to assess the incidence of CVD (CHD, stroke, and PAD), the patterns of CVD traditional risk factors, and conduct preliminary survival analysis of the traditional risk factors of CVD among Omanis with T2DM in Al Dakhiliyah Governorate (Province) of Oman. This study is a part of a project that involves patients with T2DM residing in Al Dakhiliyah Governorate. It has been established to study the CVD risk, its risk factors, and ultimately, develop a risk prediction tool that is suitable to estimate the five-year CVD risk among T2DM patients in Oman.
Methods
This study employed a retrospective cohort design. The reference population was Omani patients with T2DM residing in Al Dakhiliyah Governorate; in which diabetes care is delivered through the National Diabetes Control Program in 25 primary care institutions consisting of four polyclinics and 21 health centers. As per the diabetes control program guidelines, diabetes mellitus (DM) diagnosis is done based on the World Health Organization (WHO) cut off points. All patients were assessed at DM diagnosis, and then assessed at least annually for main risk factors and diabetes complications including CVD, using standardized assessment forms and following standardized diabetes follow-up procedures.16 All patient assessments in these institutions are administered by diabetologists, trained general physicians, and trained nursing staff. The laboratory tests were conducted by qualified laboratory technicians. All patients’ data were computerized and maintained in the diabetes registry system. Out of the 25 institutions, three polyclinics (Nizwa, Bahla, and Izki Polyclinics) and one large health center (Manah Health Centre) were selected for this study and the year 2009−2010 was considered as the baseline.
The sampling frame included all Omanis with T2DM who were recorded in the diabetes registry of the four selected institutions, who were free of CVD at baseline and showed regular follow-up visits. The patients were followed-up until the CVD outcome occurred, died, or reached end of data collection in December 2015. Exclusion criteria included patients with no annual assessment on the key factors at baseline, patients with no CVD outcome assessment at baseline, and those who developed non-ischemic heart diseases or limb amputations of non-ischemic causes in the follow-up period. In addition, patients with end stage kidney disease and liver cirrhosis were also excluded. After applying the inclusion/exclusion criteria, eligible patients for the study reached 2 039.
Demographic data, data related to risk factors at baseline, and CVD outcome data were gathered by trained staff using a well-designed data collection sheet. The data was retrieved from the patients’ medical records of the selected institutions. Sex, age at baseline, age at T2DM diagnosis, diabetes duration, body mass index (BMI), HbA1c, HTN, blood pressure (BP) control, lipid entities, albuminuria, smoking, and first degree family history of CVD were the baseline factors considered in this study.
The CVD outcome was defined as the first fatal or non fatal CHD, stroke, or PAD, diagnosed by specialized physicians based on the clinical assessment and confirmed using diagnostic tests. CHD diagnosis included stable angina, unstable angina, and myocardial infarction, and was confirmed by 12-lead electrocardiograms (ECG) and a serum troponin test. However, ECG stress test (Treadmill test) and coronary angiography were needed in instances where diagnosis was not clear. In addition, stroke was confirmed by computed tomography (CT) scan while PAD was confirmed by either clinical diagnosis of gangrene, limb amputation due to an ischemic cause, or a clinical picture of an ischemic limb confirmed by ankle-brachial pressure index and angiography. The same diagnostic criteria were applied at the baseline to ensure that the included participants were free from CVD at the beginning of the study.
The CVD outcome was traced from baseline to December 2015 (maximum of seven-year follow-up) using the same data sources by reviewing physician’s clinical notes and diagnosis for each patients and for all visits in the follow-up period. Causes of death were retrived from death certificates. Definitions of CVD outcome and main risk factors are shown in Table 1. Cut off points of various factors are considered as per the national diabetes management guideline manual.16
Table 1: Definitions of the cardiovascular outcome and the main risk factors.
|
Time to the first fatal or non-fatal CVD recorded events from the following list:
- Confirmed physician diagnosis of CHD in form of: stable angina, unstable angina, or acute myocardial infarction.
- Confirmed physician diagnosis of ischemic or hemorrhagic stroke.
- Confirmed physician diagnosis of PAD (ischemic limb, gangrene, or amputation).
|
CVD outcome |
|
Physician diagnosis of HTN
(SBP ≥ 140 mmHg or DBP ≥ 90 mmHg confirmed in BP chart readings after excluding other causes) |
HTN |
|
SPB ≥ 140 mmHg or DBP ≥ 90 mmHg |
Uncontrolled BP |
|
Total cholesterol ≥ 5.2 mmol/L |
High risk total cholesterol |
|
LDL ≥ 2.6 mmol/L |
High risk LDL |
|
HDL ≤ 0.9 mmol/L for males and ≤ 1.3 for females |
High risk HDL |
|
TG ≥ 1.7 mmol/L |
High risk TG |
|
At least one of the following: high risk cholesterol; high risk LDL; high risk HDL or high risk TG. |
Dyslipidemia |
|
Persistent albumin/creatinine ratio of ≥ 2.5 in males and ≥ 3.5 in females, confirmed at least twice within three months or more after excluding other possible causes. |
Albuminuria
(micro or macro) |
|
Good glycemic control is considered if HbA1c of < 7%, borderline control if HbA1c 7−8% and poor control if > 8% |
Glycemic control |
CVD: cardiovascular disease; CHD: coronary heart disease; PAD: peripheral arterial disease; HTN: hypertension; SBP: systolic blood pressure; DBP: diastolic blood pressure; BP: blood pressure; LDL: low density lipoprotein; HDL: high density lipoprotein; TG: triglycerides; HbA1c: glycosylated hemoglobin; BMI: body mass index.
To ensure the quality of the data, different resources of data like patients’ soft files and diabetes registers were cross-checked. Causes of death were cross-checked from patients' soft files where applicable. In addition, around 10.0% of the collected data was re-checked for consistency.
Data was analyzed using SPSS Statistics (SPSS Statistics Inc., Chicago, US) version 20.0. Incidence was expressed in percentage with 95% confidence intervals (CI). Categorical variables were presented in numbers and percentages while continuous variables were described as mean with standard deviation (SD). Continuous variables were then categorized into different levels according to clinical definitions. The univariate relationship between the CVD risk and each of the key risk factors was assessed using Kaplan-Meier (KM) survival analysis (with log-rank, Breslows and Tarone-Ware test), and chi-square test including odds ratios (OR) and 95% CI. In addition, analysis of variance (ANOVA) test was used to assess the crude relationship between continuous and categorical variables when required. A p-value
< 0.050 was considered statistically significant.
This study was approved by the Regional Research and Research Ethics Committee of the Ministry of Health in Oman, and Griffith University Research Ethics Committee as well. Due to the retrospective nature of this study, informed consent was not required and permission from involved institutions was obtained to start data collection. However, in some instances phone calls along with verbal consent were required to confirm smoking status and family history of CVD.
Results
Out of the total sample of 2 039, 64.0% were female. The mean age at baseline was 54.5±11.4 years, with minimum and maximum ages of 22.9 and 95.8 years, respectively. The mean age at DM diagnosis was 48.3±11.0, with minimum and maximum of 20 and 91 years, respectively. Contributions of the number of patients taken from the four selected institutions (Nizwa, Bahla, Izki, and Manah) in the total sample were 42.3%, 30.7%, 15.0%, and 12.0%, respectively, which were matched with the patient distribution covered by each institution. The mean, median, and maximum years of follow up were 5.3±1.1, 5.6, and 7.0, respectively. The study involved 10 910 person-years among the study sample. The mean DM duration at baseline was 5.8±4.1 years with 47.2% and 21.0% of the study sample had DM duration of < 5 and ≥ 10 years, respectively. Further details on the baseline characteristics of the study sample are shown in Table 2. The total cumulative incidence of CVD in this study was 9.4% (192/2 039; 95% CI: 8.1−10.7%) over the study period with 9.8% and 9.2% among males and females, respectively (no significant difference, p = 0.450). The incidence density was 17.6 per 1000 person-years. Of the 192 CVD events, CHD, stroke, and PAD constituted 72.4%, 20.3%, and 7.3%, respectively. Fatal CVD events were observed in 7.3% of the total CVD events. The highest annual incidence rate of CVD was 2.1% in the year 2014, the lowest was 0.7% in 2010, and the average was 1.6% per year.
Table 2: Baseline characteristics of the study sample and p-values of crude association of various factors with CVD.
|
Total number |
2 039 |
|
|
|
|
|
Sex |
|
Male |
36.0 (734/2039) |
1.1 (0.8–1.5) |
0.450 |
|
Age at baseline, years |
54.5 ± 11.4 |
< 40 |
10.9 (223/2039) |
1 |
< 0.001 |
| |
|
40−60 |
56.9 (1161/2039) |
4.8 (1.7–13.1) |
|
| |
|
≥ 60 |
32.1 (655/2039) |
9.3 (3.4–25.6) |
|
|
Age at DM diagnosis, years |
48.3 ± 11.0 |
< 40 |
21.3 (434/2039) |
1 |
< 0.001 |
| |
|
40−50 |
33.2 (677/2039) |
3.3 (1.7–6.2) |
|
| |
|
≥ 50 |
45.0 (928/2039) |
5.3 (2.9–9.7) |
|
|
DM duration, years |
5.8 ± 4.1 |
< 5 |
47.2 (962/2039) |
1 |
< 0.001 |
| |
|
10–15 |
31.8 (649/2039) |
2.6 (1.8–3.7) |
|
| |
|
≥ 10 |
21.0 (428/2039) |
2.5 (1.7–3.8) |
|
|
BMI, kg/m2 |
29.2 ± 5.4 |
< 25 |
22.1 (426/1929) |
2.4 (1.3–4.3) |
0.010 |
| |
|
25−30 |
38.9 (751/1929) |
1.9 (1.1–3.4) |
|
| |
|
30−35 |
25.2 (486/1929) |
1.4 (0.7–2.5) |
|
| |
|
≥ 35 |
13.8 (266/1929) |
1 |
|
|
HbA1c, % |
7.9 ± 2.2 |
< 7 |
41.1 (777/1891) |
1 |
0.010 |
| |
|
7–8 |
19.1 (362/1891) |
1.0 (0.6–1.6) |
|
| |
|
≥ 8 |
39.8 (752/1891) |
1.6 (1.1–2.2) |
|
|
HTN |
|
Present |
56.3 (1148/2039) |
2.1 (1.5–2.9) |
< 0.001 |
|
SBP, mmHg |
129.3 ± 14.1 |
≥ 140 |
28.2 (561/1989) |
1.1 (0.8–1.6) |
0.450 |
|
DBP, mmHg |
78.8 ± 7.4 |
≥ 90 |
15.1 (301/1989) |
1.2 (0.8–1.7) |
0.470 |
|
Total cholesterol, mmol/L |
5.0 ± 1.1 |
≥ 5.2 |
37.8 (765/2023) |
1.4 (1.0–1.9) |
0.030 |
|
LDL, mmol/L |
3.2 ± 1.0 |
≥ 2.6 |
71.7 (1015/1415) |
1.3 (0.8–1.9) |
0.300 |
|
HDL, mmol/L |
1.2 ± 0.4 |
≤ 0.9 |
57.9 (844/1458) |
1.2 (0.8–1.8) |
0.310 |
|
TG, mmol/L |
1.72 ± 1.1 |
≥ 1.7 |
38.1 (768/2018) |
1.0 (0.7–1.3) |
0.750 |
|
Dyslipidemia |
|
Present |
77.3 (1569/2030) |
1.0 (0.8–1.4) |
0.800 |
|
Albuminuria |
|
Present |
18.7 (269/1441) |
3.4 (2.4–5.0) |
< 0.001 |
|
Family history of CVD |
|
Present |
21.4 (316/1480) |
1.3 (0.8–2.0) |
0.250 |
SD: standard deviation; CI: confidence interval; OR: odds ratio; DM: diabetes mellitus; CVD: cardiovascular disease; HTN: hypertension; SBP: systolic blood pressure; DBP: diastolic blood pressure; LDL: low density lipoprotein; HDL: high density lipoprotein; TG: triglycerides; HbA1c: glycosylated hemoglobin; BMI: body mass index.
Cumulative incidence has varied significantly (p < 0.001) across institutions, with the highest in Izki polyclinic (17.6%) and the lowest in Bahla polyclinic (6.1%). With regard to sample size, ≥ 70.0% of the total sample was taken from Nizwa and Bahla polyclinics, since they cover much larger catchment area compared to other institutions. Mean follow-up periods in different institutions varied between 5.0 and 5.4 years, being longest in Nizwa and lowest in Izki. Poor glycemic control in Izki, Manah, Nizwa, and Bahla was observed in 46.2%, 41.0%, 36.0%, and 41.0%, respectively, while the mean diabetes duration in different institutions varied between 5.5 years and 6.0 years.
Baseline data among the study group showed a high prevalence of the CVD traditional risk factors [Table 2]. The mean BMI was 29.2±5.4 kg/m2, and 38.9% were overweight (BMI 25–30) and similar proportion were obese (BMI ≥ 30). Poor glycemic control was also a dominating risk factor. The mean HbA1c was 7.9±2.2%, and around 40.0% and 19.0% of the study sample were having poor (HbA1c : > 8%) and borderline (HbA1c : 7–8%) glycemic control at baseline, respectively. Dyslipidemia was observed in about 77.0% of the study sample. The mean cholesterol level was 5.0±1.1 and 37.8% of the participants had total cholesterol level of ≥ 5.2 mmol/L. In addition, 71.7%, 57.9%, and 38.1% of the study sample had high risk low density lipoprotein (LDL), high risk high density lipoprotein (HDL), and high risk triglycerides (TG), respectively. The mean systolic blood pressure (SBP) was 129.3±14.1 and 56.3% of the participants were hypertensive, of which 46.6% had uncontrolled BP. Micro/macro-albuminuria, first degree family history of CVD, and smoking were observed in 18.7%, 21.4%, and 7.8%, respectively.
The crude survival analysis using KM survival curves along with the ORs and chi-square test showed significant association between CVD risk and the following factors: age, HbA1c, albuminuria, BMI, DM duration, HTN, and total cholesterol. Table 2 presents the distributions of different factors in the study sample and their crude associations with CVD outcome.
Age at baseline was observed to have the strongest association with CVD among all predictors. Figure 1 shows a sharp increase in the CVD risk over time with increasing age. The crude OR for patients aged ≥ 60 years compared to patients aged < 40 years was 9.3 (95% CI 3.4–25.6, p < 0.001). Similarly, the increase in the hazard trend of CVD risk over time was sharper among patients with DM duration 5–10 years and ≥ 10 years compared to those with DM duration < five years (crude OR for both groups was 2.5; 95% CI 1.7–3.8, p < 0.001). However, there was no difference in the hazard trend of CVD risk between the two former groups (p = 0.800). The difference in hazard trend of CVD risk between the good glycemic control and the poor glycemic control groups was also observed to be significant (OR 1.6; 95% CI 1.1–2.2). However, there was no significant difference in hazard trend between good and borderline glycemic control groups (p = 0.900).
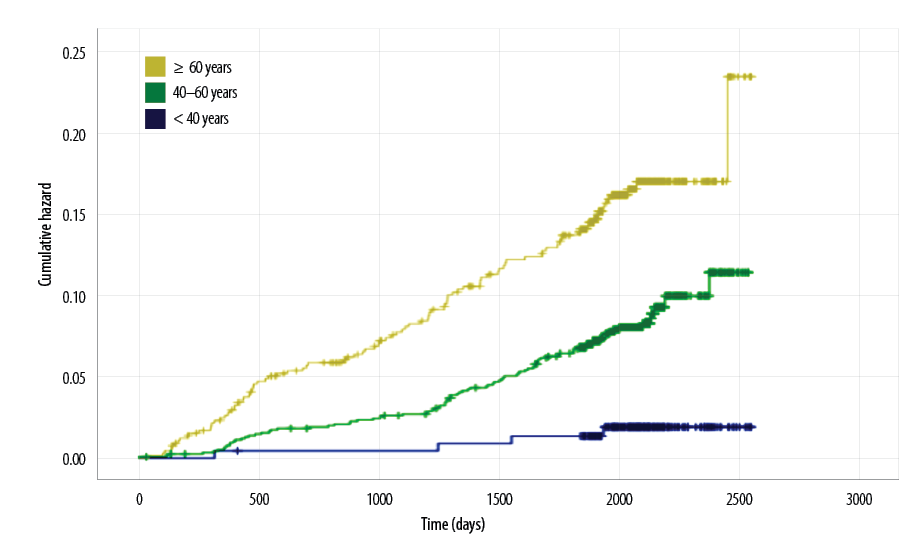
Figure 1: Cardiovascular disease hazard function according to the age groups at baseline.
BMI was observed to be inversely related to the CVD risk [Figure 2]. The ORs showed increasing trend with decreasing BMI levels. The highest group at risk was the group with the normal BMI compared to the lowest one, which was the one with morbid obesity (OR 2.4; 95% CI 1.3–4.3). However, ANOVA test showed that the mean DM duration was significantly higher among normal weight patients (2 220 days) compared to the obese patients (2 010 days), with p = 0.047. Moreover, HTN, albuminuria, and high total cholesterol were also observed to be strongly associated with increasing hazard trends of CVD risk (crude ORs and 95% CI 2.1, 1.5–2.9; 3.4, 2.4–5.0; and 1.4, 1.0–1.9, respectively).
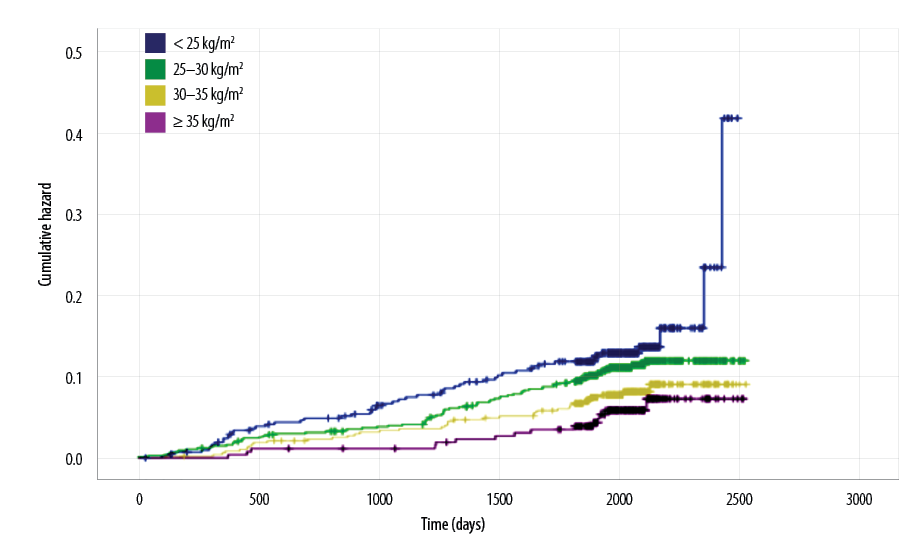
Figure 2: Cardiovascular disease hazard function according to body mass index groups.
Discussion
Findings of this longitudinal study included the high five-year CVD cumulative incidence (9.4%); the high prevalence of main CVD risk factors like HTN, obesity, poor glycemic control, dyslipidemia, and albuminuria; and the insignificant association between CVD and some of the traditional risk factors such as smoking and family history of CVD in the crude analysis.
CVD incidence varies considerably across different populations with diabetes, depending on the study setting, ethnic background, inclusion criteria, CVD outcome definition, and duration of the follow-up. Unfortunately, no longitudinal studies could be found in the literature related to CVD incidence among T2DM patients in the neighboring Arabian countries. However, globally, some studies showed a lower incidence compared to ours, while others showed a much higher incidence. Studies in general practice settings in Scotland and China showed that 5.3% and 4.9% of T2DM developed CVD within median periods of 4.1 and 5.4 years, respectively.6,17 However, in these two studies the considered outcome was CHD alone. An Italian population based study revealed a cumulative incidence of 7.6%.18 However, the study had a short follow-up period (four years) and the outcome included only CHD. In contrast, many other studies demonstrated much higher incidence. In this context, the Finnish and the ARIC population based studies in Finland and US found that the cumulative incidence of CHD alone to be 20.2% and 17.1% over periods of seven and 10 years, respectively.7,19 In England, the CVD incidence was observed to be 17.9% over a period of 5.5 years.20 In the Finnish and ARIC studies, patients less than 45 years of age were not included and they involved a relatively longer period of follow-up. Whereas the possible reason for the higher CVD incidence in the English study was that the CVD outcome included other cardiovascular abnormalities like heart failure and arrhythmias in addition to CHD, PAD, and stroke. Longitudinal data from community based and primary care settings in Australia and New Zealand showed higher four-year and five-year CVD events cumulative incidence (14.9% and 17.9%, respectively) compared to the present study.4,5 While sudden death was not included in the CVD outcome in the present study, it was included in the Australian study. The New Zealand study involved a longer duration of follow-up (eight years). Thus, our relatively lower incidence maybe explained partially by the non-selective sampling since the participants age ranged between 22.9 and 95.8 years, intermediate period of follow-up (mean of 5.3 years), and that the definition of CVD was confined to CHD, PAD, and stroke, excluding sudden death. However, the expected variation in the CVD incidence in populations with different ethnicities, lifestyles, and cultures might be a better explanation.15
In this study, CVD incidence varied considerably across the involved four institutions. It was higher among Izki polyclinic and Manah health center compared to Nizwa and Bahla polyclinics. This may be explained by the higher prevalence of poor glycemic control in Izki and Manah. In addition, since more than 70% of the total sample was taken from Nizwa and Bahla polyclinics, this might had an effect on the observed difference.
The present study showed a high prevalence of most of the traditional risk factors such as obesity, poor glycemic control, HTN, dyslipidemia, and albuminuria. Some of the traditional factors have been excluded in the univariate association with CVD risk. Many of previous longitudinal studies with similar cohorts have shown similar results, however, some important differences were observed.4,17,20,21 For example, current smoking in the present study showed low prevalence (7.8%) and was not associated with CVD. A longitudinal study among English patients with diabetes showed the prevalence of current smoking to be around 34% in men and 25% in women, while in New Zealand it was 15%.4,21 Other global studies even with low CVD incidence have also showed higher prevalence of smoking among the study groups.6,10,17 Although most of the related studies showed significant association between smoking and CVD, some of them have revealed insignificant association even in the univariate analysis.5,10,18 Low prevalence of smoking among general population and population with diabetes in Oman has been observed by many studies.22−24 This may be explained by the social and cultural stigma towards this habit, which may prevent people from smoking or may result in under-reporting. These are the potential reasons for the insignificant association between smoking and CVD observed in this study.
Although the observed high proportion of obesity is consistent with many previous local and global studies,4,11,17,20,21 the inverse univariate association with CVD is another interesting finding conflicting with many related studies.5,18,19 However, other studies revealed an insignificant role for obesity in CVD occurrence.25,26 Therefore, a sort of controversy in the independent role of obesity in CVD occurrence among populations with diabetes is still there.8 In this study, this relationship maybe confounded by the diabetes duration which was significantly higher among obese patients as shown by the ANOVA test. Future studies can assess this in more details.
High levels of total cholesterol, LDL and TG, and low levels of HDL were observed to be of high prevalence in this study and in many other local and global studies.10,13,17 The insignificant univariate association between CVD and lipid entities (LDL, HDL, and TG) except the total cholesterol, is another interesting finding related to the pattern of CVD risk factors. LDL, HDL, and/or TG have shown significant association with CVD in many studies,5,19,27 however, serum cholesterol was also observed to be associated with CVD in the univariate and/or multivariate analysis.17−19,21 The insignificant association between CVD and other lipid entities was also observed in other studies.10,17 Since different good quality studies can yield different association results, not only for the lipid factors, but for other factors as well, it seems that the pattern of CVD associations with different factors is affected by population characteristics. It is likely that different populations may yield different results. Despite the well-known relationship of CVD with gender and first degree family history of CVD revealed by many studies,4,5,10,17,28 our study showed insignificant associations. However, the same was observed in some studies for the latter,6,18 which may be explained by the recall bias in reporting this risk factor.
This study was the first longitudinal study addressing the CVD incidence and risk factor patterns among T2DM patients in Oman and the neighboring Arab countries. It involved a good sample size taken from primary care settings where all patients with diabetes are registered and managed, and hence, the sample was likely to be a representative one. In contrast, the problems of recall bias and missing data were major constraints due to the retrospective nature of the study. These were partially overcome by cross-checking different sources of data. In addition, types of anti-diabetes, anti-hypertensive, and anti-lipid drugs were not included in this study. However, the effects of anti-diabetes, anti-hypertensive, and anti-lipid treatments are expected to be included in the levels of diabetes control, HTN control, and lipid profile to some extent, respectively. Similarly, physical inactivity was not considered in this study due to the difficulties in quantifying and gathering the related data.
Conclusion
The incidence of CVD and the prevalence of its risk factors among Omanis with T2DM were both high. Important differences in the picture of the CVD risk factors and their preliminary associations with CVD compared with global studies have been observed. This may be attributed to the strong relationship between the geographical location of the patients’ environmental and lifestyle factors with
diabetes complications.15,29
Disclosure
The authors declared no conflicts of interest. This study was funded by the Center of Studies and Research of the Ministry of Health- Oman, and the Population and Social Health Research Program (PSHRP) of Menzies Health Institute- Queensland.
references
- 1. van Dieren S, Beulens JW, van der Schouw YT, Grobbee DE, Neal B. The global burden of diabetes and its complications: an emerging pandemic. Eur J Cardiovasc Prev Rehabil 2010 May;17(1)(Suppl 1):S3-S8.
- 2. Beckman JA, Creager MA, Libby P. Diabetes and atherosclerosis: epidemiology, pathophysiology, and management. JAMA 2002 May;287(19):2570-2581.
- 3. Kannel WB, McGee DL. Diabetes and cardiovascular disease. The Framingham study. JAMA 1979 May;241(19):2035-2038.
- 4. Elley CR, Robinson E, Kenealy T, Bramley D, Drury PL. Derivation and validation of a new cardiovascular risk score for people with type 2 diabetes: the new zealand diabetes cohort study. Diabetes Care 2010 Jun;33(6):1347-1352.
- 5. Davis WA, Knuiman MW, Davis TM. An Australian cardiovascular risk equation for type 2 diabetes: the Fremantle Diabetes Study. Intern Med J 2010 Apr;40(4):286-292.
- 6. Yang X, So W-Y, Kong AP, Ma RC, Ko GT, Ho C-S, et al. Development and validation of a total coronary heart disease risk score in type 2 diabetes mellitus. Am J Cardiol 2008 Mar;101(5):596-601.
- 7. Haffner SM, Lehto S, Rönnemaa T, Pyörälä K, Laakso M. Mortality from coronary heart disease in subjects with type 2 diabetes and in nondiabetic subjects with and without prior myocardial infarction. N Engl J Med 1998 Jul;339(4):229-234.
- 8. Martín-Timón I, Sevillano-Collantes C, Segura-Galindo A, Del Cañizo-Gómez FJ. Type 2 diabetes and cardiovascular disease: Have all risk factors the same strength? World J Diabetes 2014 Aug;5(4):444-470.
- 9. Sharma MD, Farmer JA, Garber A. Type 2 diabetes and cardiovascular risk factors. Curr Med Res Opin 2011 Nov;27(S3)(Suppl 3):1-5.
- 10. Kengne AP, Patel A, Marre M, Travert F, Lievre M, Zoungas S, et al; ADVANCE Collaborative Group. Contemporary model for cardiovascular risk prediction in people with type 2 diabetes. Eur J Cardiovasc Prev Rehabil 2011 Jun;18(3):393-398.
- 11. Al Riyami A, Elaty MA, Morsi M, Al Kharusi H, Al Shukaily W, Jaju S. Oman world health survey: part 1 - methodology, sociodemographic profile and epidemiology of non-communicable diseases in oman. Oman Med J 2012 Sep;27(5):425-443.
- 12. Pieris RR, Al-Sabti HA, Al-Abri QS, Rizvi SG. Prevalence Pattern of Risk Factors for Coronary Artery Disease among Patients Presenting for Coronary Artery Bypass Grafting in Oman. Oman Med J 2014 May;29(3):203-207.
- 13. Al-Rawahi AH. Prevalence and Risk Factors of diabetic Nephropathy in Omani Type 2 diabetics in Al-Dakhiliyah Region- A thesis submitted in partial fulfillment of the requirement for the Degree of Master of Science in Biomedical Sciences, Major: Epidemiology and Medical Statistics. Oman: college of Medicine and Health Sciences-Sultan Qaboos University; 2011.
- 14. Alrawahi AH, Rizvi SG, Al-Riyami D, Al-Anqoodi Z. Prevalence and risk factors of diabetic nephropathy in omani type 2 diabetics in Al-dakhiliyah region. Oman Med J 2012 May;27(3):212-216.
- 15. Al-Rawahi A, Lee P. Applicability of the Existing CVD Risk Assessment Tools to Type II Diabetics in Oman: A Review. Oman Med J 2015 Sep;30(5):315-319.
- 16. Ministry of Health-Department of Non Communicable Disease Control. Diabetes Mellitus Management Guidelines. Third edition. Sultanate of Oman: Ministry of Health; 2015.
- 17. Donnan PT, Donnelly L, New JP, Morris AD. Derivation and validation of a prediction score for major coronary heart disease events in a U.K. type 2 diabetic population. Diabetes Care 2006 Jun;29(6):1231-1236.
- 18. Avogaro A, Giorda C, Maggini M, Mannucci E, Raschetti R, Lombardo F, et al; Diabetes and Informatics Study Group, Association of Clinical Diabetologists, Istituto Superiore di Sanità. Incidence of coronary heart disease in type 2 diabetic men and women: impact of microvascular complications, treatment, and geographic location. Diabetes Care 2007 May;30(5):1241-1247.
- 19. Folsom AR, Chambless LE, Duncan BB, Gilbert AC, Pankow JS; Atherosclerosis Risk in Communities Study Investigators. Prediction of coronary heart disease in middle-aged adults with diabetes. Diabetes Care 2003 Oct;26(10):2777-2784.
- 20. Shah AD, Langenberg C, Rapsomaniki E, Denaxas S, Pujades-Rodriguez M, Gale CP, et al. Type 2 diabetes and incidence of cardiovascular diseases: a cohort study in 1·9 million people. Lancet Diabetes Endocrinol [Internet]. 2014 [cited 2015 Apr 16]. Available from: http://www.sciencedirect.com/science/article/pii/S2213858714702190. 21.
- Stevens RJ, Kothari V, Adler AI, Stratton IM, Holman RR, Group UK; United Kingdom Prospective Diabetes Study (UKPDS) Group. The UKPDS risk engine: a model for the risk of coronary heart disease in Type II diabetes (UKPDS 56). Clin Sci (Lond) 2001 Dec;101(6):671-679.
- 22. Al-Lawati JA, Barakat MN, Al-Lawati NA, Al-Maskari MY, Elsayed MK, Mikhailidis DP, et al. Cardiovascular risk assessment in diabetes mellitus: comparison of the general Framingham risk profile versus the World Health Organization/International Society of Hypertension risk prediction charts in Arabs–clinical implications. Angiology 2013 Jul;64(5):336-342.
- 23. Mabry RM, Winkler EA, Reeves MM, Eakin EG, Owen N. Correlates of Omani adults’ physical inactivity and sitting time. Public Health Nutr 2013 Jan;16(1):65-72.
- 24. Al-Lawati JA, Mohammed AJ, Al-Hinai HQ, Jousilahti P. Prevalence of the metabolic syndrome among Omani adults. Diabetes Care 2003 Jun;26(6):1781-1785.
- 25. Chen XY, Thomas GN, Chen YK, Chan JC, Wong KS. Atherosclerotic vascular disease rather than metabolic syndrome predicts ischemic stroke in diabetic patients. Cerebrovasc Dis 2010;30(4):374-379.
- 26. Scott R, Donoghoe M, Watts GF, O’Brien R, Pardy C, Taskinen M-R, et al; FIELD Study Investigators. Impact of metabolic syndrome and its components on cardiovascular disease event rates in 4900 patients with type 2 diabetes assigned to placebo in the FIELD randomised trial. Cardiovasc Diabetol 2011 Nov;10(1):102.
- 27. Haffner SM; American Diabetes Association. Management of dyslipidemia in adults with diabetes. Diabetes Care 2003 Jan;26(Suppl 1):S83-S86.
- 28. Scheuner MT, Setodji CM, Pankow JS, Blumenthal RS, Keeler E. Relation of familial patterns of coronary heart disease, stroke, and diabetes to subclinical atherosclerosis: the multi-ethnic study of atherosclerosis. Genet Med 2008 Dec;10(12):879-887.
- 29. Green C, Hoppa RD, Young TK, Blanchard JF. Geographic analysis of diabetes prevalence in an urban area. Soc Sci Med 1982. 2003 Aug;57(3):551–60.