|
Introduction
The glomerular filtration rate (GFR) is traditionally considered the best overall index of renal function in health and disease.1-3 The gold standard for the evaluation of the GFR is insulin clearance but its widespread use is limited by several technical difficulties.4 The 99mTc-DTPA renography which was introduced by Gates,5 is considered to be more accurate than 24 hours creatinine clearance and is recommended for clinical use in patients with reduced renal function.6 In 99mTc-DTPA renography, the GFR is calculated without the need for blood or urine sampling.7
Calculation of GFR using an empirical mathematical formula has been encouraged as a simple, rapid and reliable means of assessing kidney function.8-10 There are no fewer than 46 different prediction equations currently available, although the two most commonly used are the Cockcroft-Gault (CG),11 and Modification of Diet in Renal Disease (MDRD) formulas.10 Cystatin C is a 132-aminoacid 13-kDa cysteine protease inhibitor produced by all nucleated cells and whose function is thought to be modulation of the intracellular catabolism of proteins.12 It is formed at a constant rate and is freely filtered by the renal glomeruli and completely reabsorbed and catabolized by the proximal tubular cells.12-16
The objective of the present study was to investigate the usefulness of serum cystatin C compared with serum creatinine, estimated GFR using (CG & MDRD) and measured GFR.
Methods
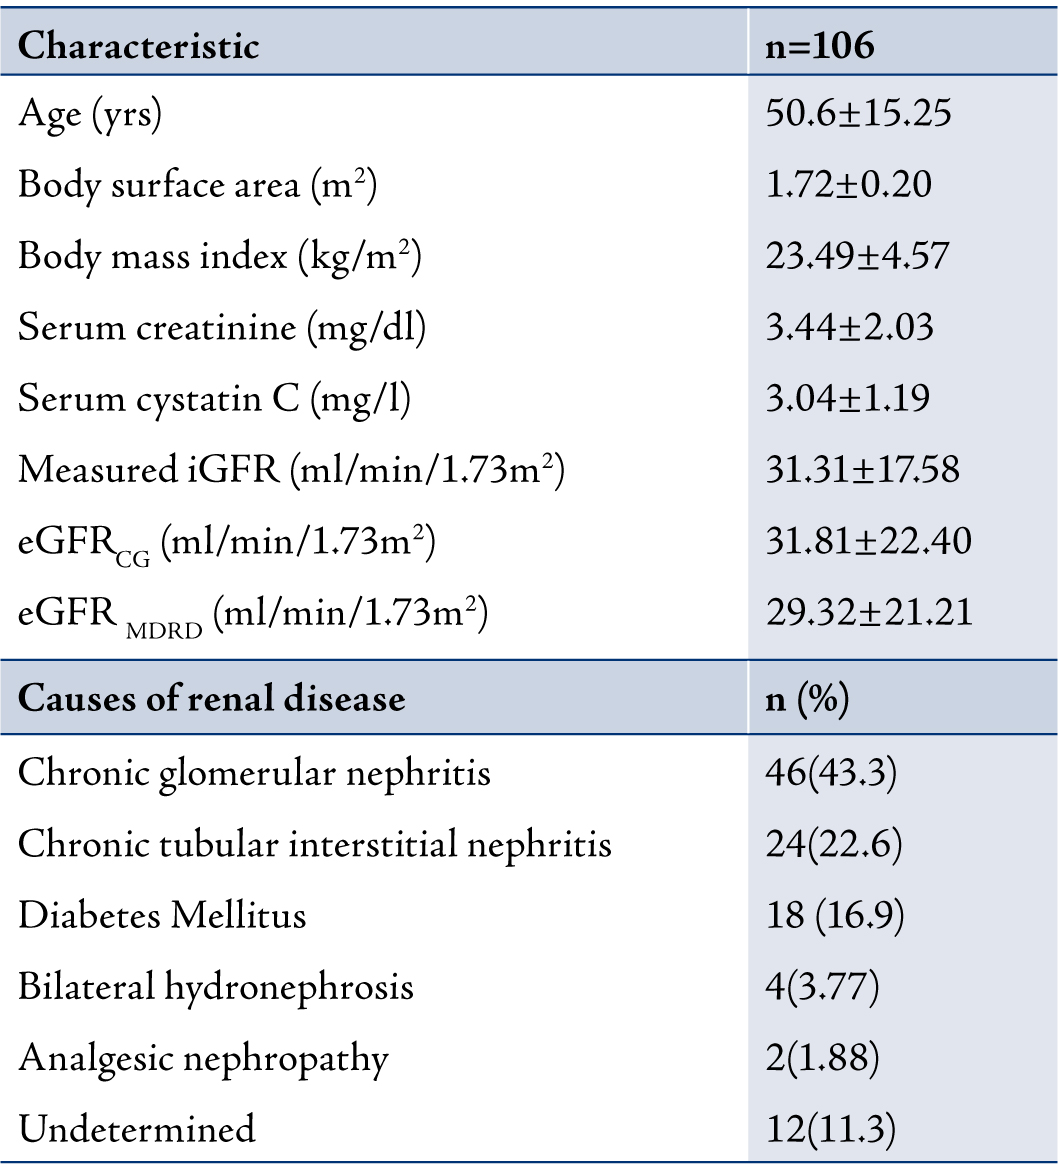
One hundred and six chronic kidney disease (CKD) patients (82 males, 24 females) with a mean age of 50.61±15.25 years (range: 21 to 85 years) were included in this study. There are no studies conducted on the Indian population comparing cystatin C and creatinine levels with GFR based on age groups. The patients were categorized into 3 groups based on age namely; group I (≤40 years; n=26), group II (41-59 years; n=54) and group III (≥60 years; n=26). The etiology of CKD were chronic glomerular nephritis (n=46; 43.3%), chronic tubular interstitial nephritis (n=24; 22.6%), diabetes mellitus (n=18; 6.9%), bilateral hydronephrosis (n=4; 3.77%), analgesic nephropathy (n=2; 1.88%) and undetermined (n=12; 11.3%). (Table 1)
For measuring the GFR using the 99mTc-DTPA Renography, the patients were made to lie down on a bed in the supine position and 99mTc-DTPA was injected through an indwelling butterfly needle in an anticubital vein and was followed by infusion of 20 ml of normal saline. Frames of 128 × 128 matrix were recorded with an online-computer, initially at one second for one minute and then at 10 seconds for 20 minutes.
Table 1: Characteristic of patients with CKD. Data are presented as mean±SD and mean (%).
Region of interest (ROI) over each kidney was assigned manually on the frame added from 1 to 3 minutes following injection. The semi lunar background ROI around each kidney was defined and was modified for the inferior ROI’s in the original gates. The background corrected time-activity curve was generated and the renal uptake of individual kidney for one minute from 2 to 3 minutes after the injection was calculated. The GFR was automatically estimated by a commercially available computer program (E. CAM, Siemens, USA) according to the Gate’s algorithm.
GFR Estimation and Normalization of GFR were calculated
using the following equations:
CG Method: GFR (ml/min/1.73m2) = [(140-age) × weight (kg)](/ 72 × S.Cr (mg/dl
For women, multiply with 0.85
The GFR (ml/min) is obtained by CG method normalized for a body surface area of 1.73m2 according to Haycock’s Equation.17
MDRD method: GFR (ml/min) = 186 × (S.Cr in mg/dl) -1.54 × age -0.203
For women, multiply with 0.742
Serum cystatin C was measured using particle enhanced nephelometric immunoassay (PENIA) kit (Dade Behring, Marbug, GmbH, Germany). While serum creatinine was measured by Jaffe’s method using an autoanalyser (Biosystems, USA). Written consent was obtained from all the study participants.
Statistical significance among the groups was determined using the Medcalc 8.1 statistical software (Belgium). Values are given as mean ± standard deviation. The association between cystatin C and creatinine with isotopic GFR and estimated GFR was assessed by Pearson correlation and stepwise multiple regression analysis. A value p<0.05 was considered statistically significant.
Results
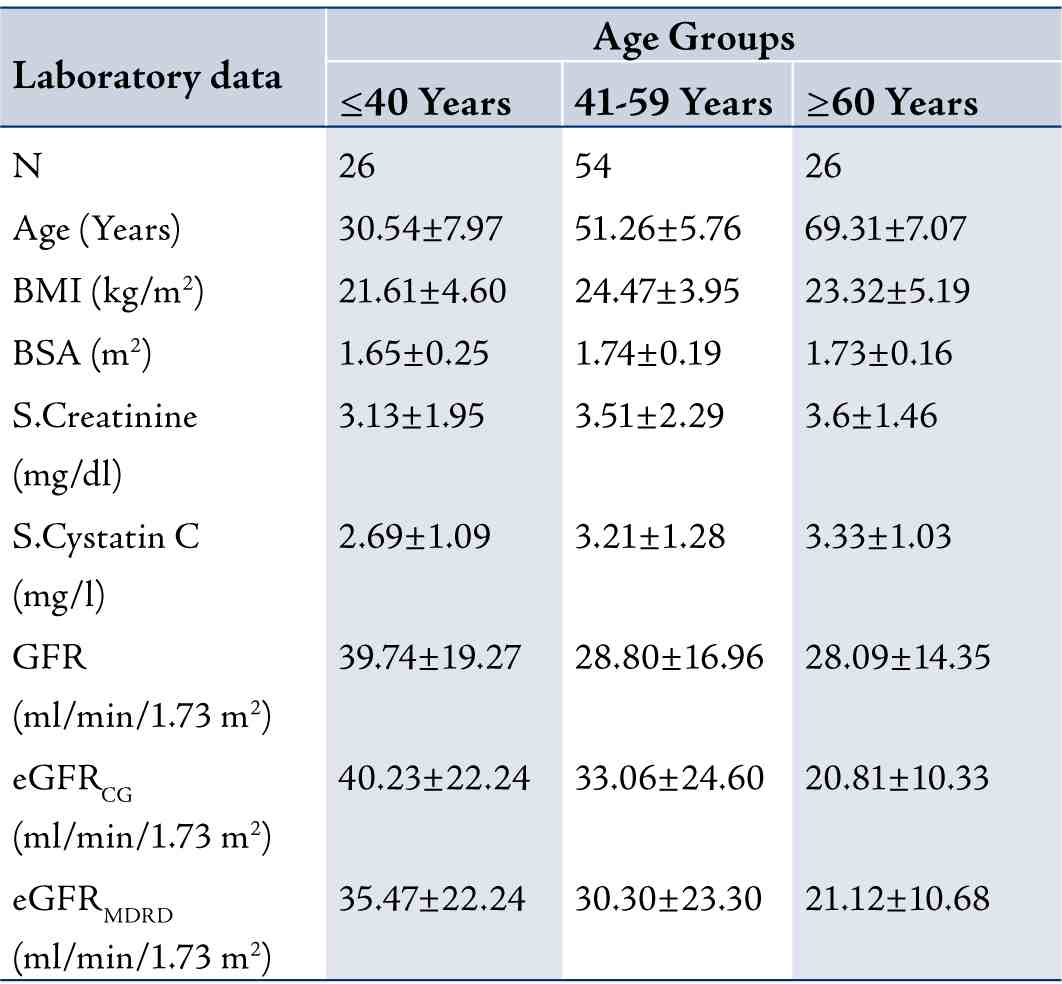
In terms of the correlation between cystatin C and creatinine with measured GFR and eGFR in this study, the results showed that as the age of the CKD patient’s increased, the GFR slightly decreased and the cystatin C levels significantly increased. Table 2 shows the measured GFR, eGFRCG, eGFRMDRD, cystatin C and creatinine levels of the three groups based on age. The stepwise multiple regression between cystatin C with measured GFR showed significant correlation with measured GFR (r=-0.9735; p<0.001) than serum creatinine with measured GFR in group 1, (Fig. 1). Serum creatinine correlates well with eGFRCG &MDRD (r=-0.8516; p<0.0001 and r=-0.8157; p<0.0001, respectively) than cystatin C with eGFRCG &MDRD (r=-0.7894; p<0.0001 and r=-0.7777; p<0.0001, respectively) in the same group. The receiver operating curve (ROC) analysis indicates that the cystatin C has (AUC: 0.753; sensitivity: 73.1%) higher sensitivity than creatinine (AUC: 0.655; sensitivity: 48.3%). (Fig. 2)
Table 2: Laboratory data for participants stratified by Age Groups (n = 106). Data are presented as mean±SD
In group II, the stepwise multiple regression between cystatin C with measured GFR showed significant correlation (r=-0.8975, p<0.0001) than creatinine with measured GFR (r=-0.6852), as shown in Fig. 3. The cystatin C correlates well with eGFRCG&MDRD (r=-0.7649; p<0.0001 and r=-0.7753; p<0.0001) than creatinine with eGFRCG&MDRD (r=-0.7460 and r=-0.7673, respectively). The ROC analysis demonstrated that cystatin C (AUC: 0.725; sensitivity: 84.5%) exhibits higher sensitivity than creatinine (AUC: 0.571; sensitivity: 33.9%). (Fig. 4)
In Group III, the stepwise multiple regression between cystatin C with measured GFR showed that cystatin C significantly correlates with measured GFR (r=-0.7994; p<0.0001) than creatinine with measured GFR (r=-0.5127) as shown in Fig. 5. Serum creatinine correlates with eGFRCG &MDRD (r=-0.9018; p<0.0001 and r=-0.9504; p<0.0001) than cystatin C (r=-0.6010 and r=-0.5668). The ROC analysis indicated that cystatin C (AUC: 0.767; sensitivity: 96.8%) exhibits higher sensitivity than creatinine (AUC: 0.586; sensitivity: 61.3%). (Fig. 6)
For the correlation between cystatin C and creatinine with age, Body Mass Index (BMI) and Body Surface Area (BSA), the results showed no significant correlation with cystatin C (r=0.0350, r=-0.0934 and r=-0.0358, respectively; p>0.05). Creatinine also exhibited no correlation with age and BSA (r=-0.1136, r=-0.1049, respectively; p>0.05) but a correlation was observed creatinine and BMI (r=-0.4228; p=0.0314) in group I.
In group II, the age, BMI and BSA did not correlate with cystatin C (r=0.1719, r=0.0883 and r=-0.2257, respectively; p>0.05). Similarly, there was no correlation between age and BMI with creatinine but a correlation was observed between BSA and creatinine (r=-0.2580; p=0.0596).
Similar to groups I and II, in group III there was also no correlation between age, BMI and BSA with cystatin C (r= 0.1762, r=0.3261; and r=0.2357, respectively; p>0.05) and with creatinine (r=-0.2541, r=0.2837 and r=-0.0796, respectively; p>0.05).
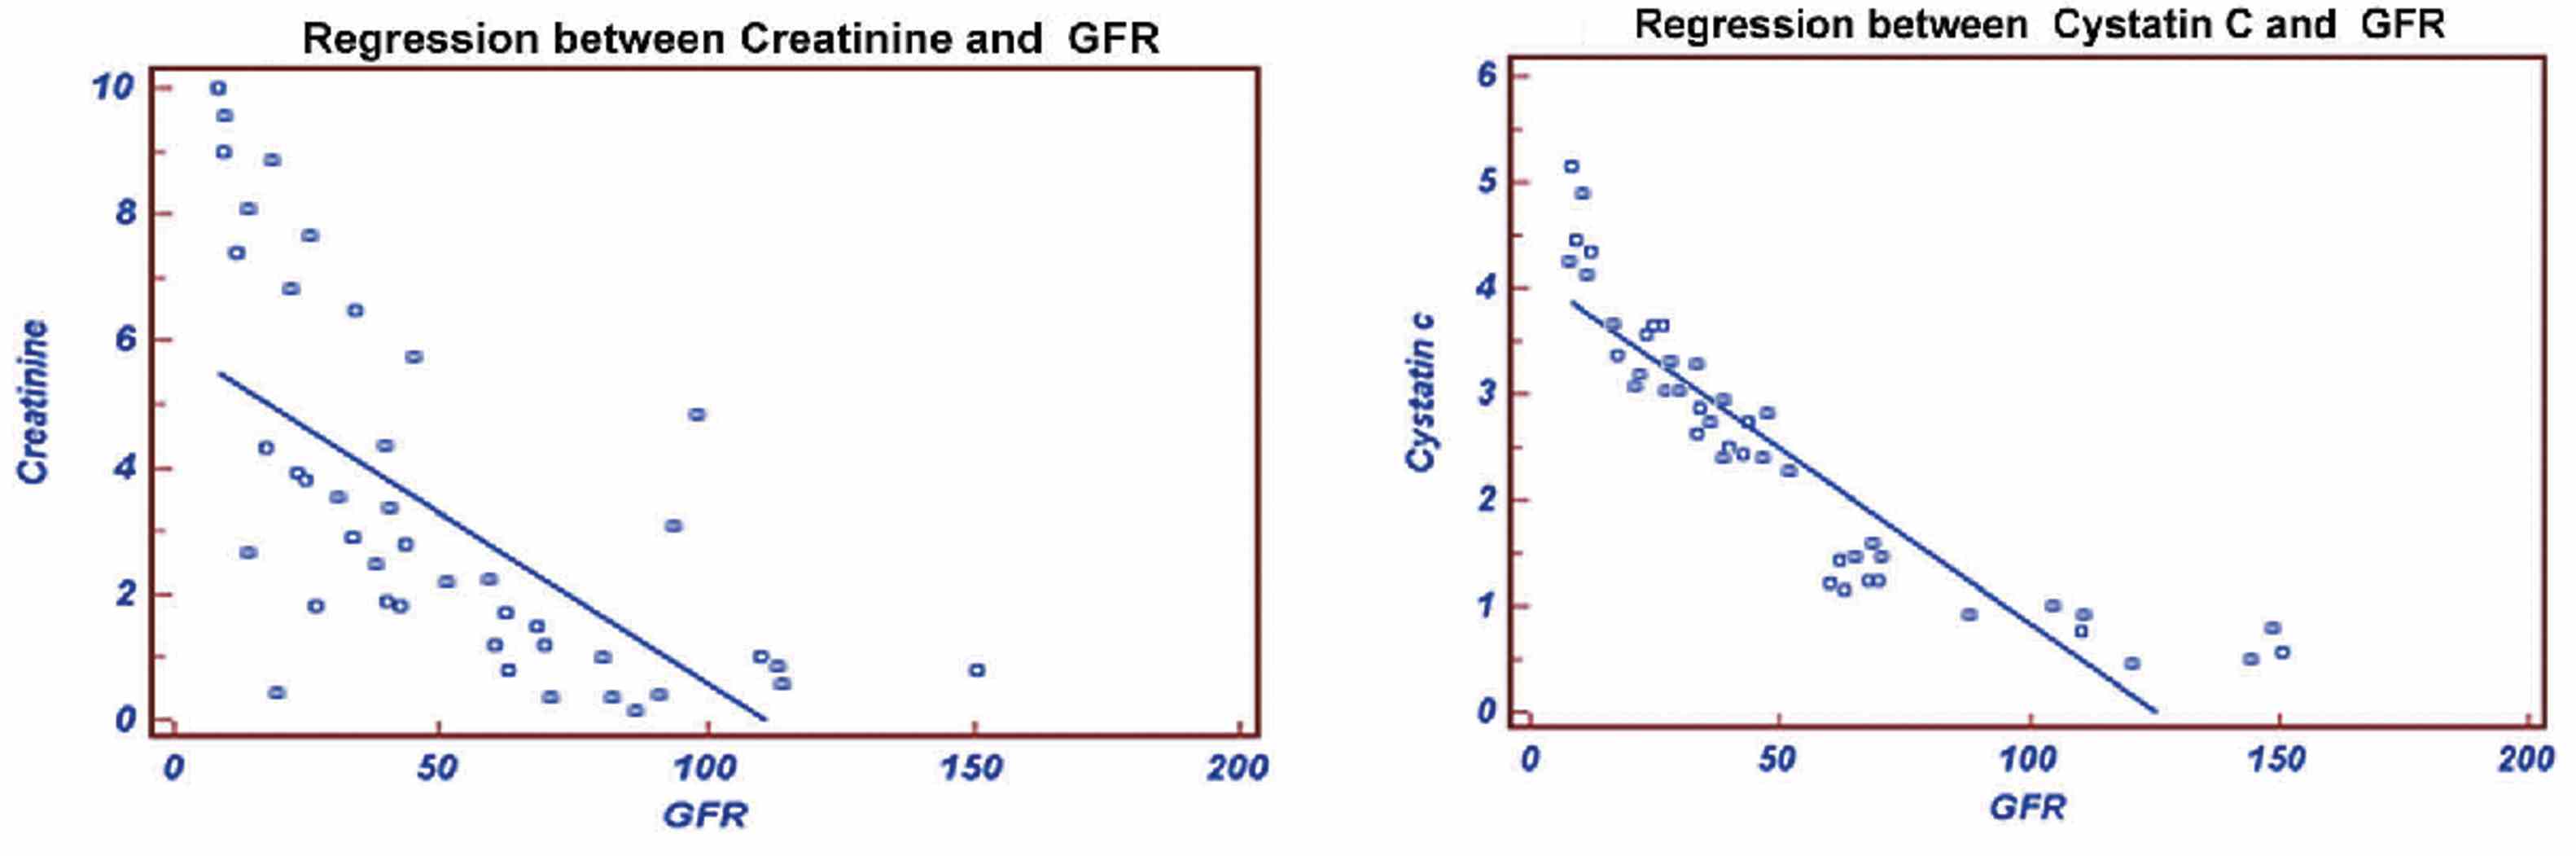
Figure 1: Regression of Creatinine and Cystatin C with GFR.
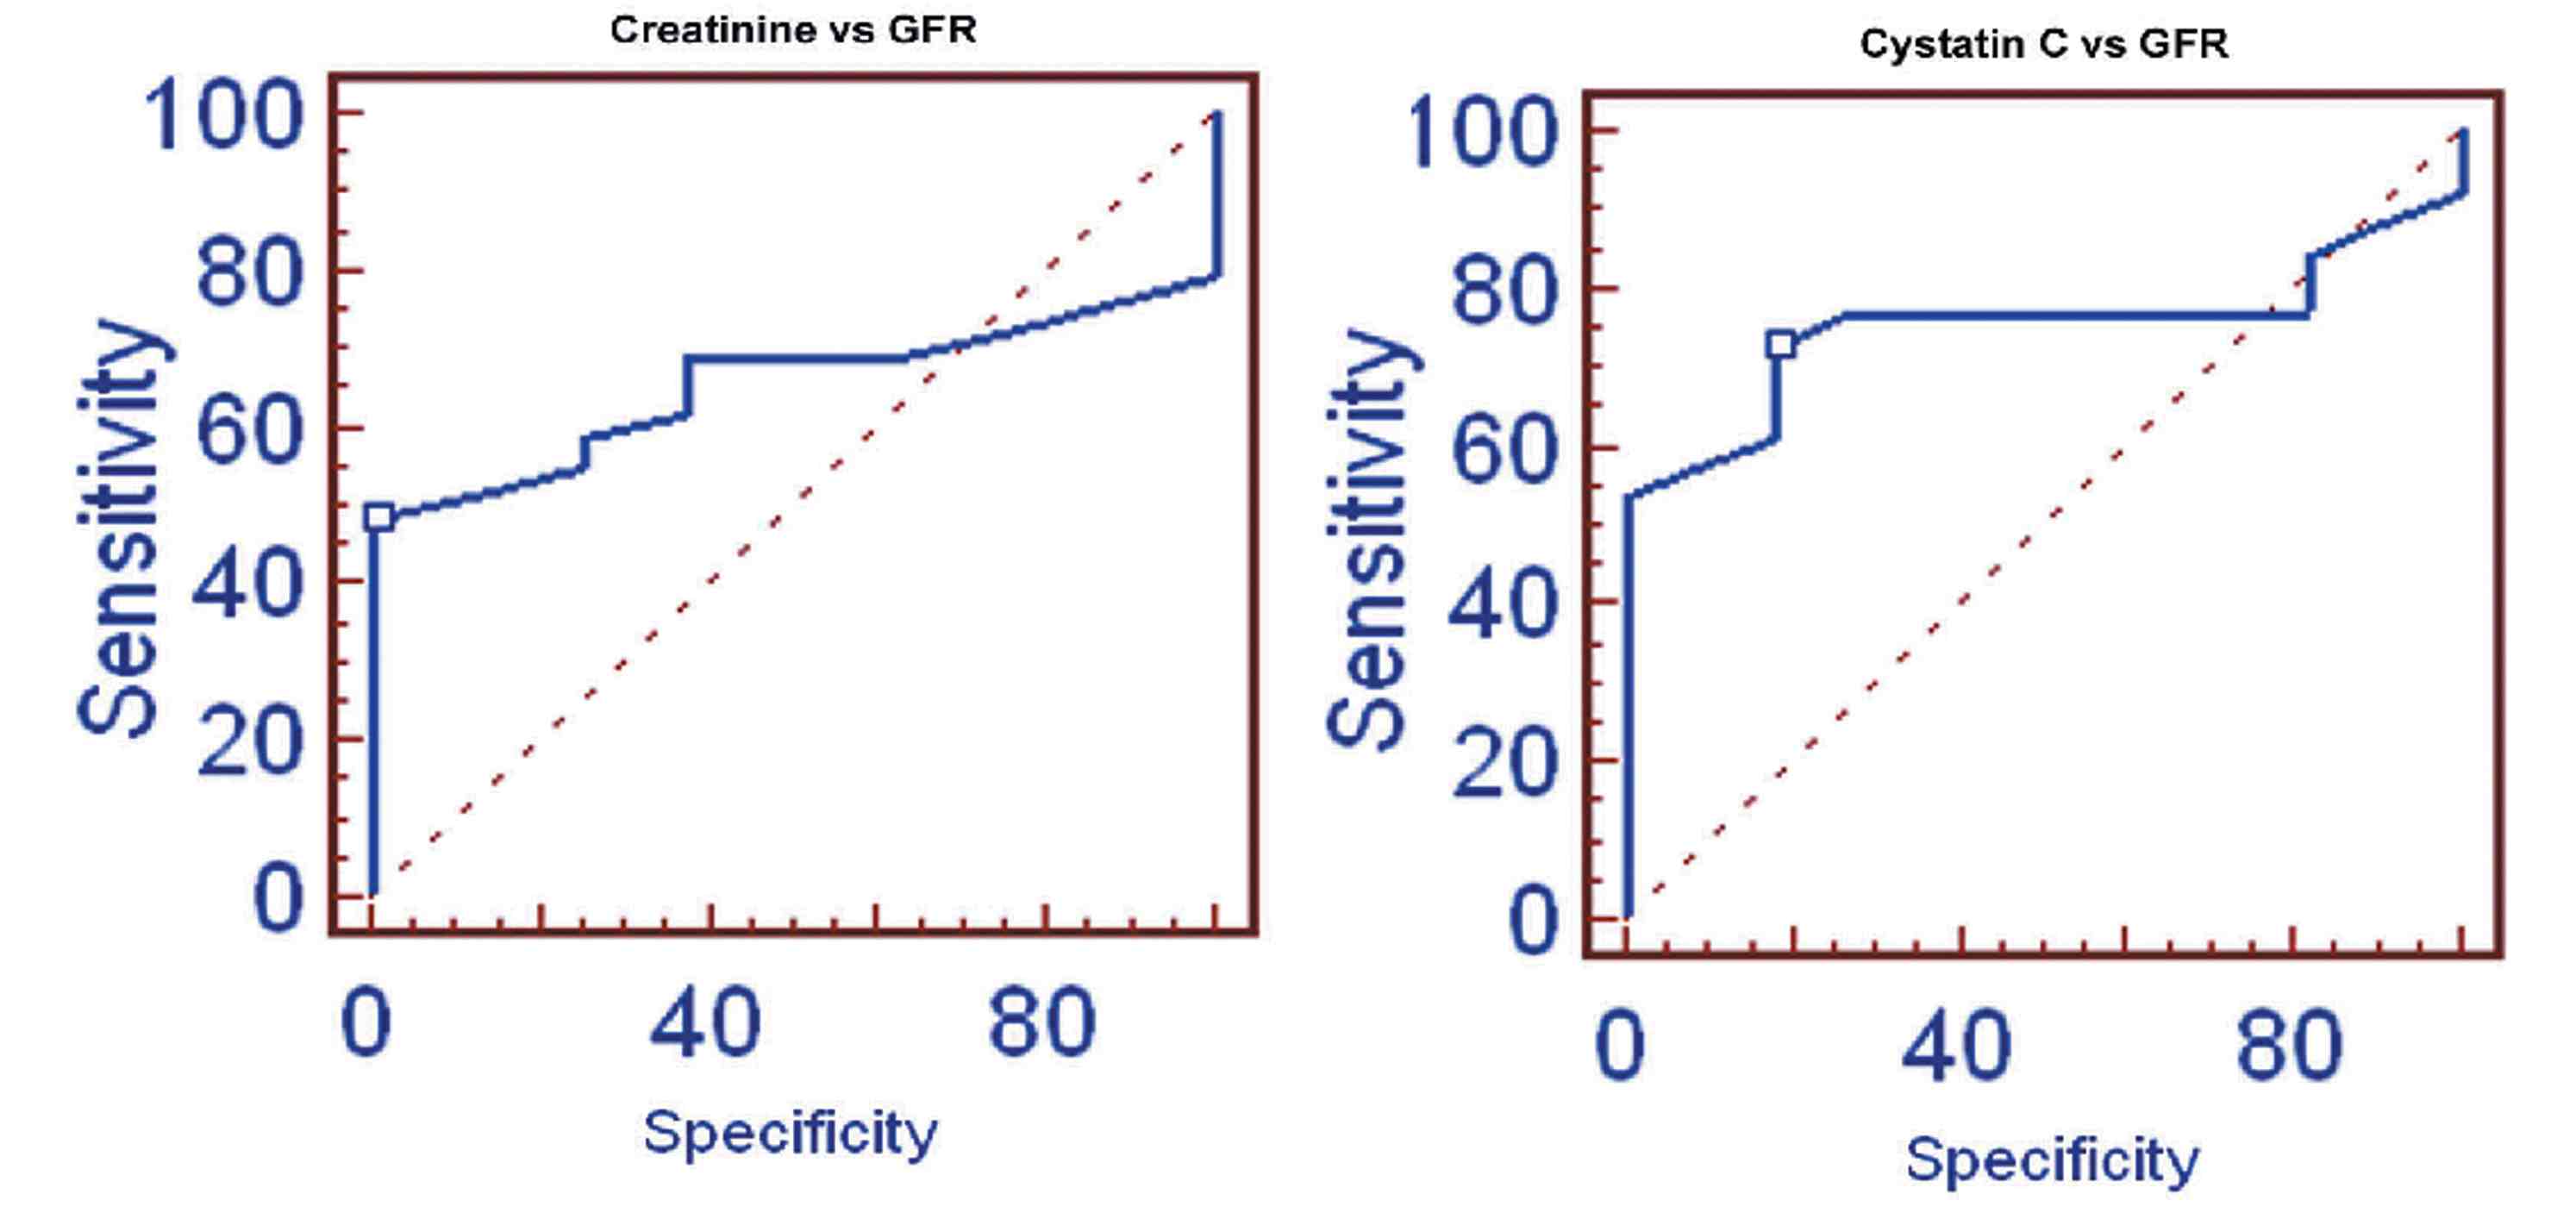
Figure 2: ROC of Creatinine and Cystatin C with GFR.
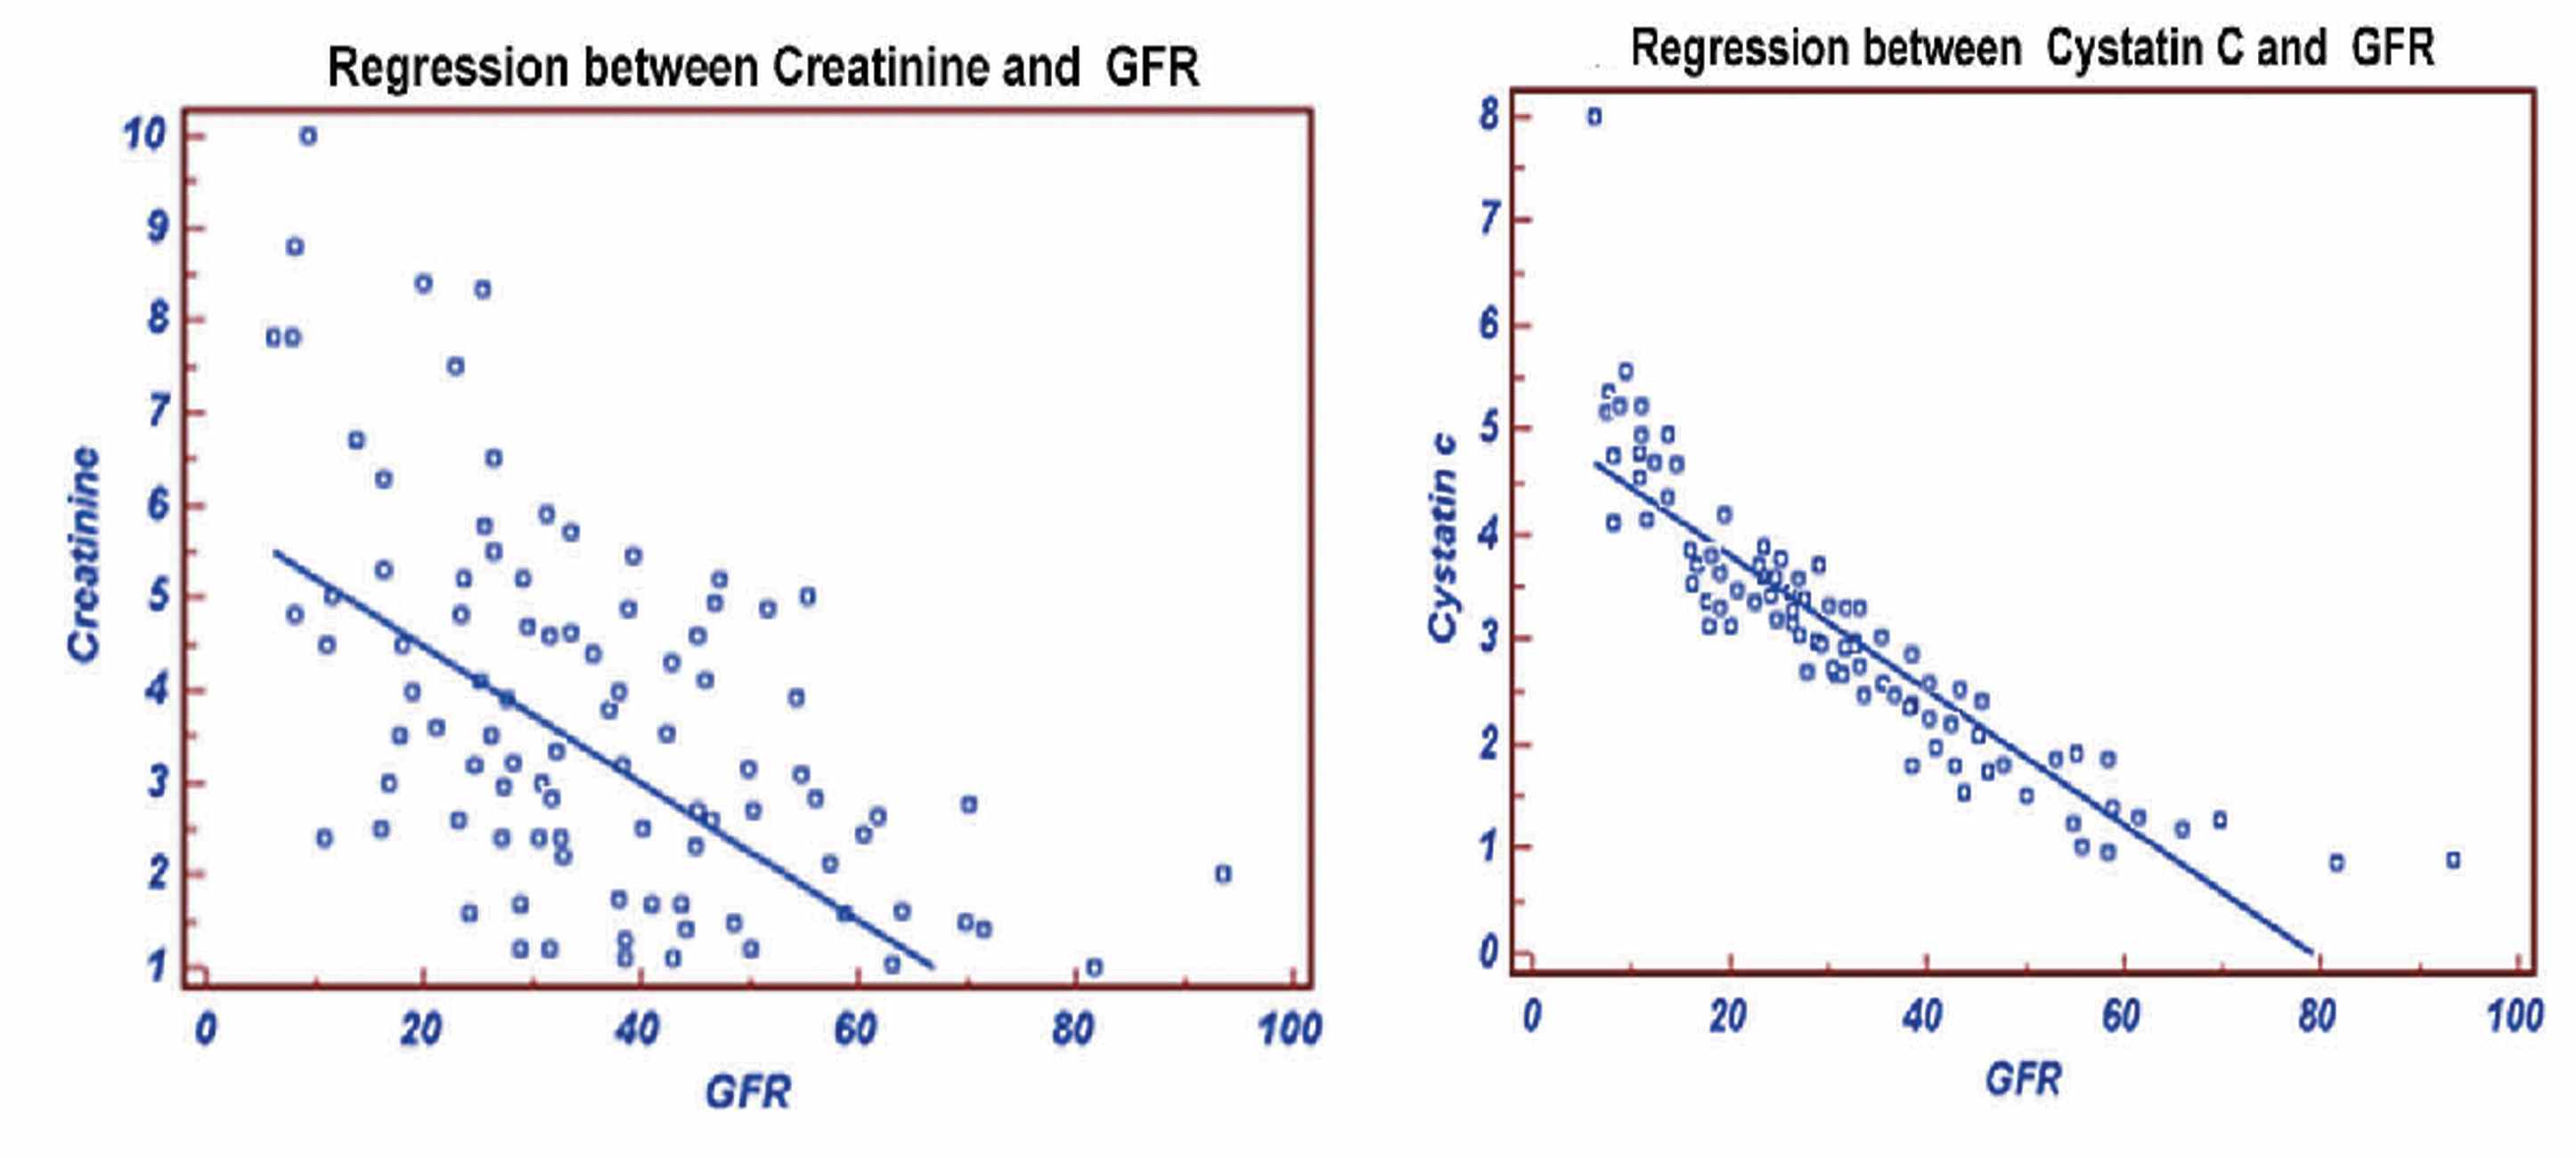
Figure 3: Regression of Creatinine and Cystatine with GFR.
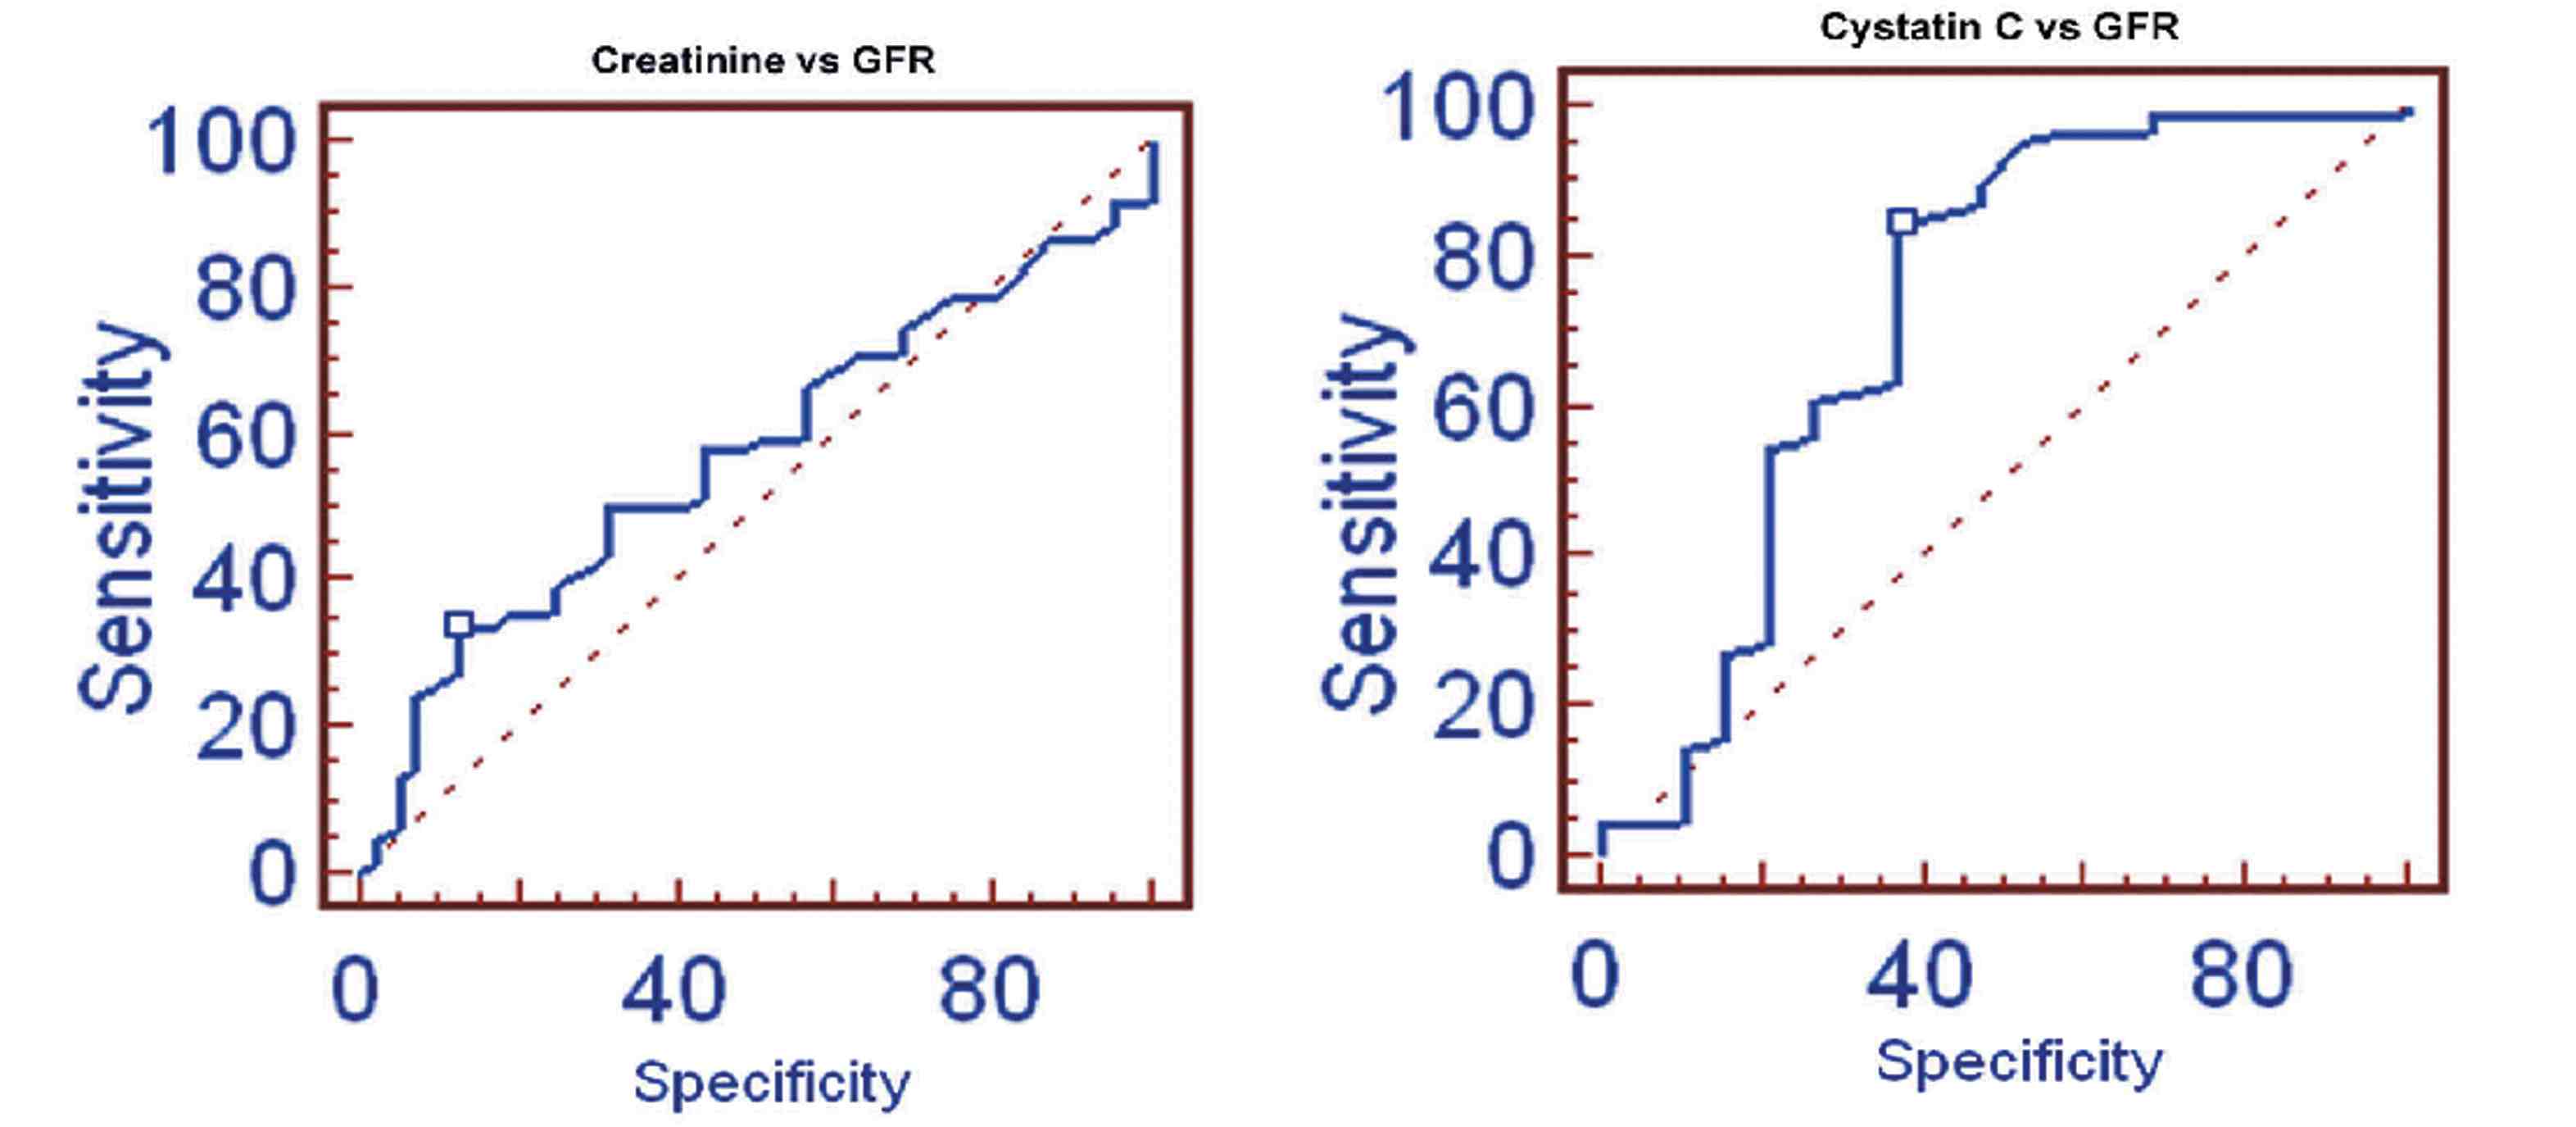
Figure 4: ROC of Creatinine and Cystatin C with GFR.
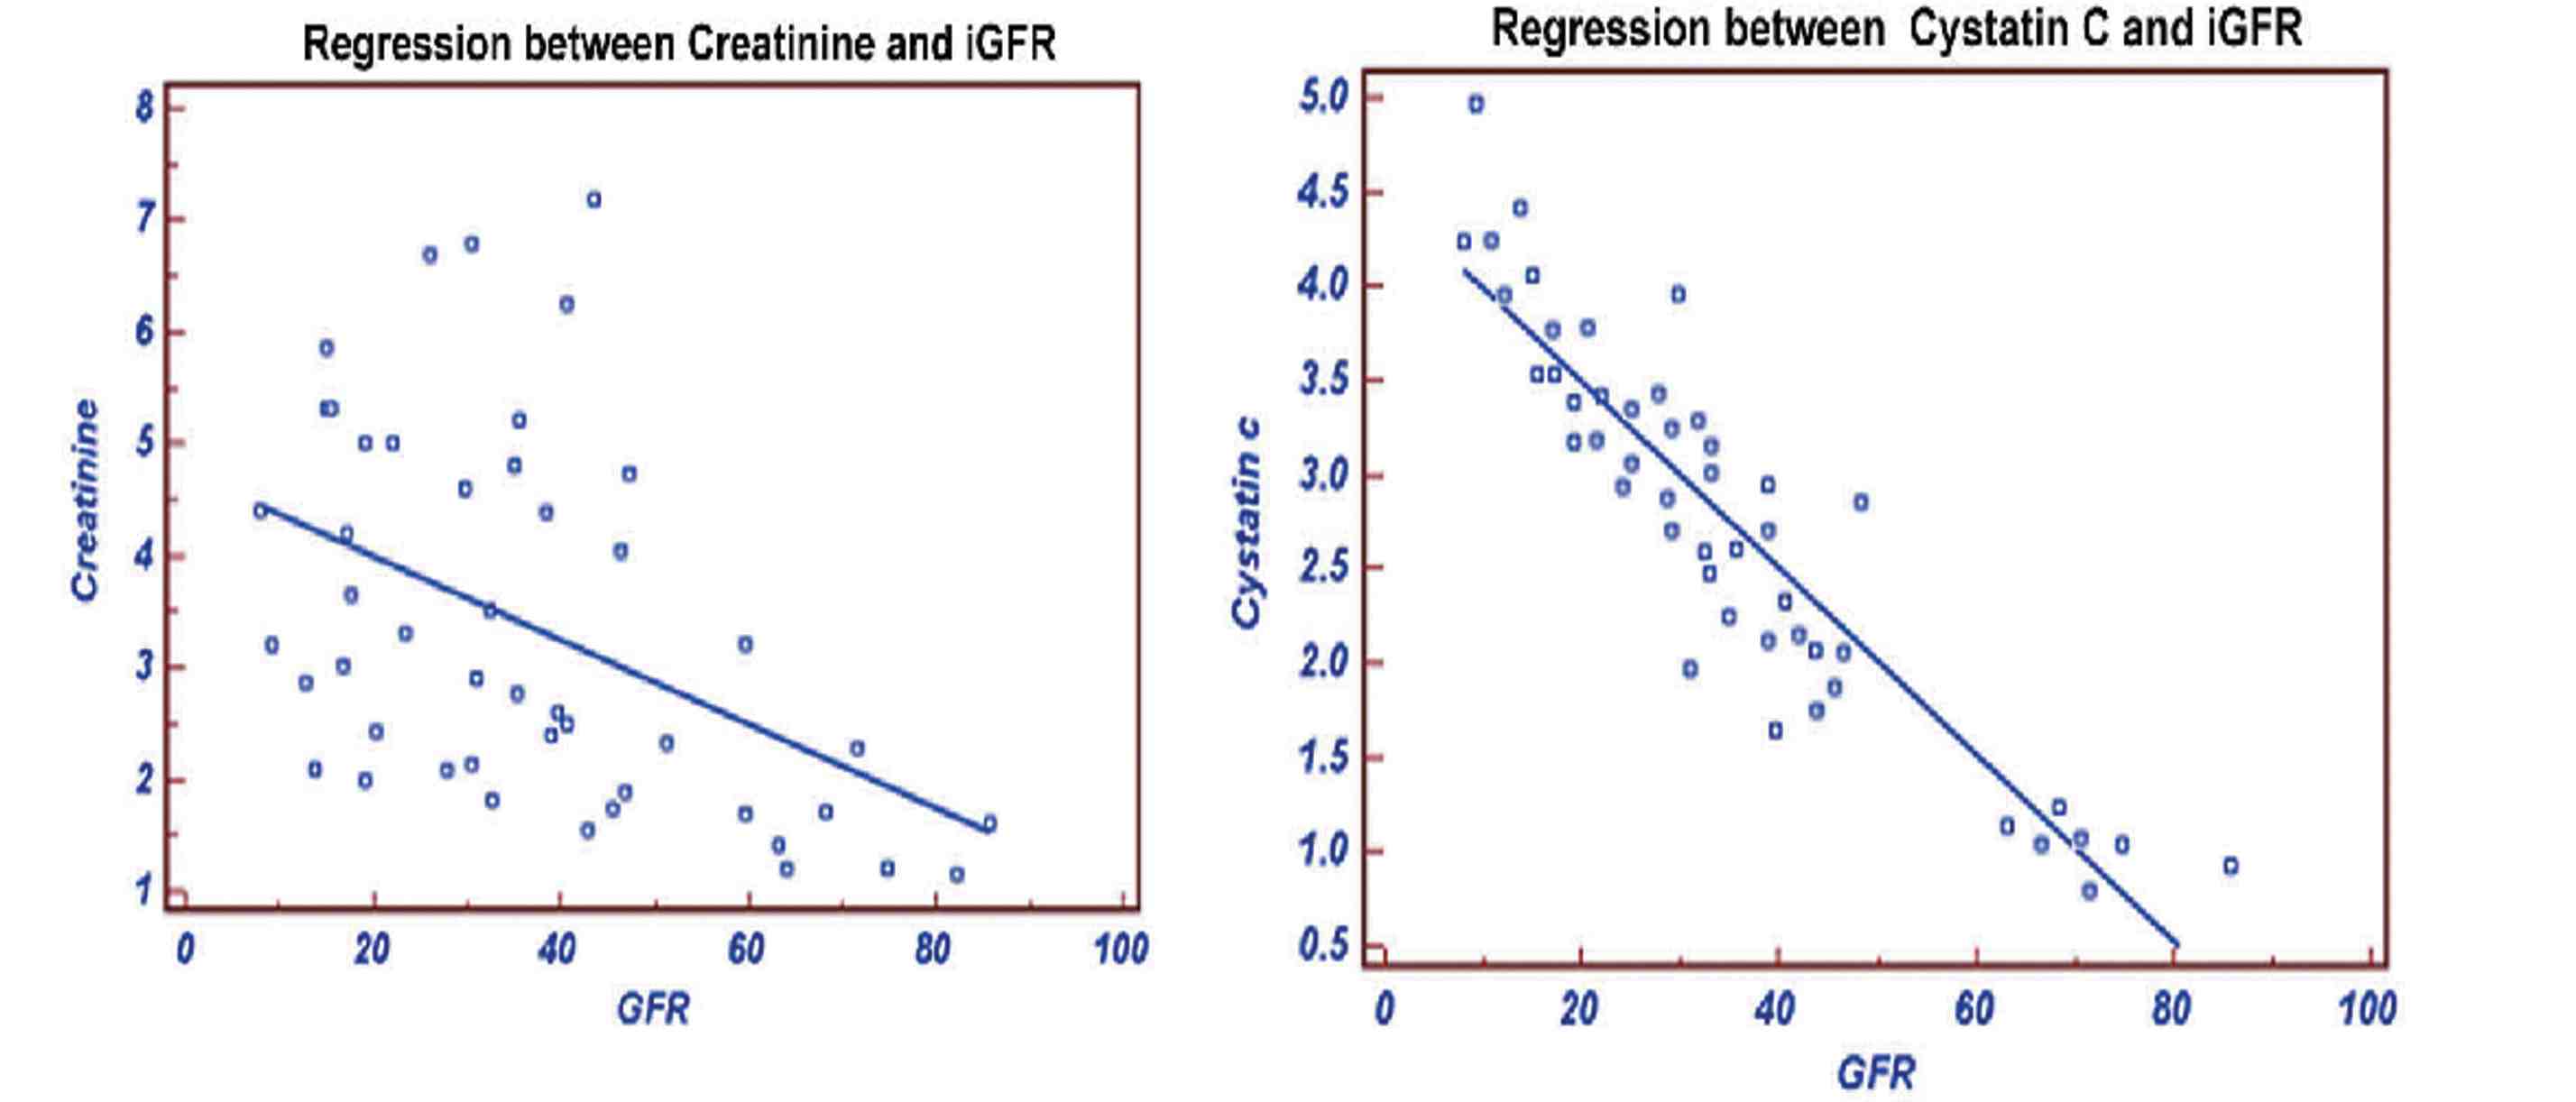
Figure 5: Regression of Creatinine and Cystatin C with GFR.
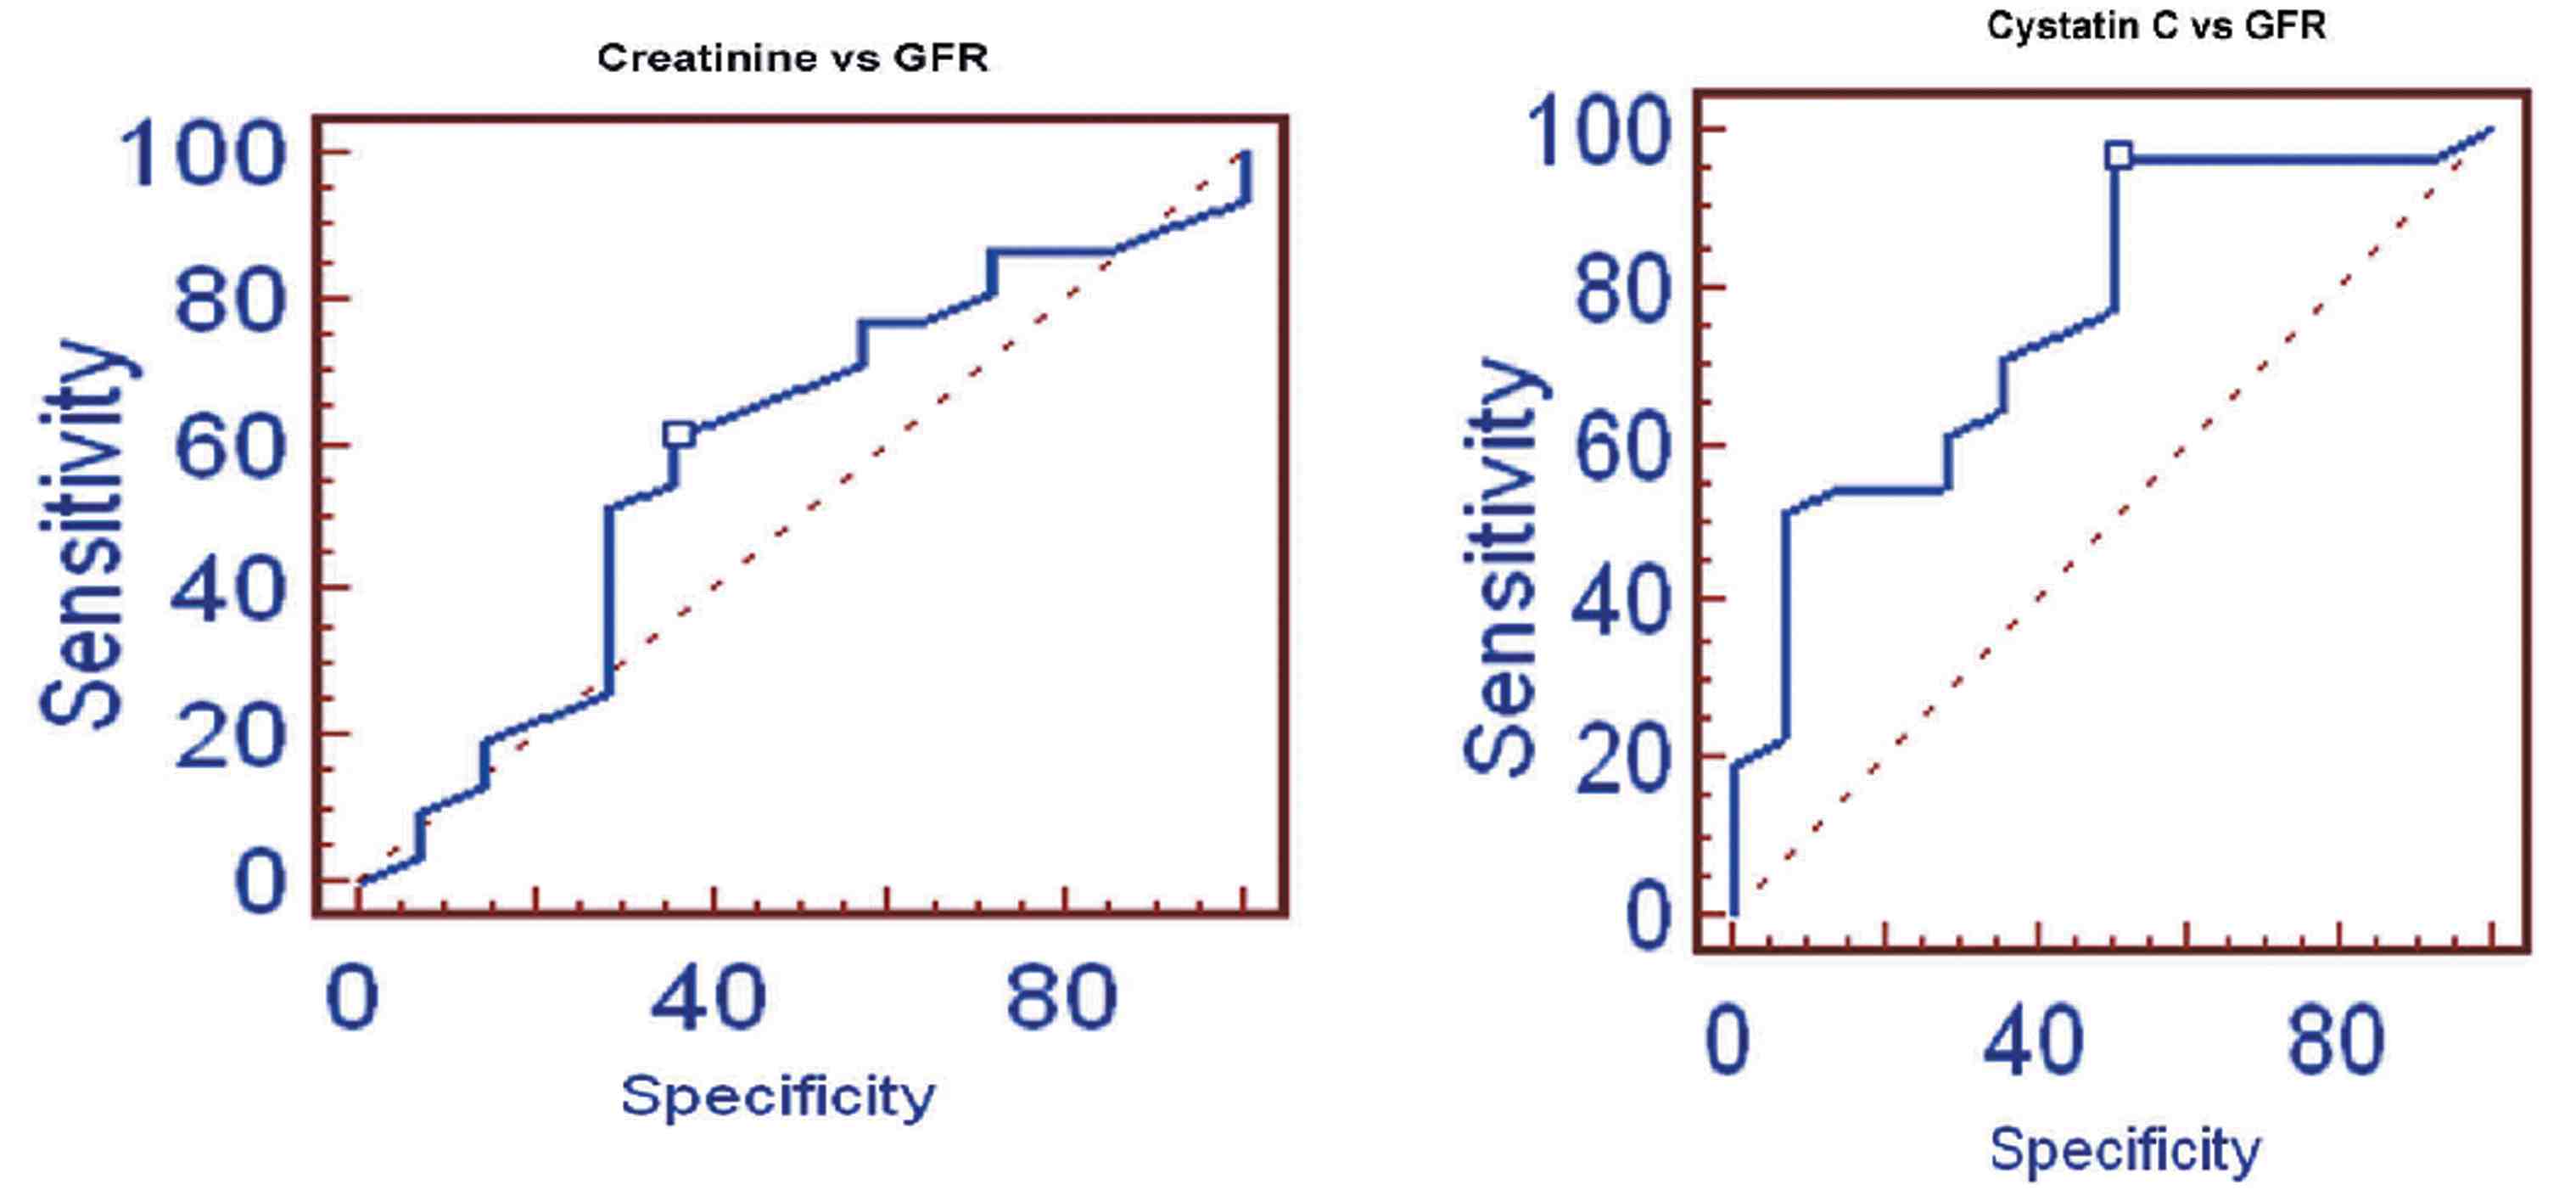
Figure 6: ROC of Creatinine and Cystatin C with GFR.
Discussion
Low molecular weight proteins are eliminated mainly through glomerular filtration which renders their measurements potential markers of renal function.18 The substances most extensively studied in this respect are α1-microglobulin,14,19 and β2-microglobulin,14,19-21 both of which have their limitations. Serum α1-microglobulin, which is of hepatic origin, is largely bound to IgA and albumin and thus not freely filtered. The production rate of β2-microglobulin varies considerably with immune reactions as it is a part of the histocompatibility antigen complex and produced predominantly by lymphocytes.19,21 These limitations do not apply to cystatin C for which both a constant production rate and free glomerular filtration have been documented.22-24
It has been unambiguously proved that creatinine varies with age, gender and body mass. But in the case of cystatin C, there are conflicting views, some evidence supporting,25 and certain other evidence opposing,26,27 the influence of age, gender and body mass on cystatin C levels. To investigate this conflict, the present study was conducted in Indian patients with CKD.
The results of this study showed that serum cystatin C is the most useful endogenous marker of GFR in all age groups. In this study, we compared the diagnostic value of cystatin C, creatinine, CG and MDRD formulae for GFR in assessment of renal function based on age groups. The correlation of cystatin C with GFR was comparable to that of creatinine, CG and MDRD formulae in all age groups. These results suggest that cystatin C is a good marker of renal function in patients with renal impairment, as has been reported in non-diabetic patients,28-32 patients with renal transplant,33 and in healthy patients.34
Cystatin C is proposed to reflect GFR independent of age and body composition.21,35,36 Also in the present study, similar findings have been observed. In addition, it was found that serum creatinine may be influenced with body composition up to 60 years. Serum creatinine correlated well with GFR than serum cystatin C, which may be due to the eGFR being calculated using the creatinine levels. Whereas, in middle aged group the cystatin C correlated well with eGFR than creatinine. This may be due to the increased amount of BMI in that group.
This is also evidence that confirms the influence of creatinine with body mass. In the study by O’Riodan et al. among 53 geriatric outpatients aged >70 years, cystatin C was considerably more accurate than creatinine in estimating GFR, with values greater than reference range having a 97% sensitivity in detecting GFR <60 ml/min/1.73m2 compared with a sensitivity of only 37% for creatinine.37 Similarly, the present study also revealed that cystatin C is found to be more accurate than creatinine in estimating GFR with 96.8% sensitivity, compared with a sensitivity of 61.3% for creatinine in patients >60 years. The other two age groups also showed similar findings. An increased serum cystatin C concentration may provide a clinically important indication of a decreased GFR, even if serum creatinine concentration remains unchanged.38 Similar findings were observed in the present study, but cystatin C tends to increase in patients up to 60 years and then significantly decreased. This fact confirms that cystatin C is less dependent on age groups.
Conclusion
Cystatin C seems to be a promising alternative to creatinine as an endogenous marker of GFR in CKD patients in adults and older age groups. Serum cystatin C is directly related with GFR but not with age, and is also not influenced by BMI and body surface area, whereas serum creatinine is influenced by body mass. These findings may improve the utility of cystatin C as a laboratory diagnosis test for assessment of renal function.
Acknowledgements
The authors reported no conflict of interest and no funding was received for this work.
References
1. Smith HW. Diseases of the kidney and urinary tract. In the kidney: structure and function in health and disease. New York. Oxford Univ Pr 1951;1951:836-887.
2. National Kidney Foundation. K/DOQI clinical practice guidelines for chronic kidney disease: evaluation, classification, and stratification. Am J Kidney Dis 2002 Feb;39(2)(Suppl 1):S1-S266.
3. Johnson CA, Levey AS, Coresh J, Levin A, Lau J, Eknoyan G. Clinical practice guidelines for chronic kidney disease in adults: Part II. Glomerular filtration rate, proteinuria, and other markers. Am Fam Physician 2004 Sep;70(6):1091-1097.
4. Shemesh O, Golbetz H, Kriss JP, Myers BD. Limitations of creatinine as a filtration marker in glomerulopathic patients. Kidney Int 1985 Nov;28(5):830-838.
5. Gates GF. Glomerular filtration rate: estimation from fractional renal accumulation of 99mTc-DTPA (stannous). AJR Am J Roentgenol 1982 Mar;138(3):565-570.
6. Petersen LJ, Petersen JR, Talleruphuus U, Møller ML, Ladefoged SD, Mehlsen J, et al. Glomerular filtration rate estimated from the uptake phase of 99mTc-DTPA renography in chronic renal failure. Nephrol Dial Transplant 1999 Jul;14(7):1673-1678.
7. Prigent A, Cosgriff P, Gates GF, Granerus G, Fine EJ, Itoh K, et al. Consensus report on quality control of quantitative measurements of renal function obtained from the renogram: International Consensus Committee from the Scientific Committee of Radionuclides in Nephrourology. Semin Nucl Med 1999 Apr;29(2):146-159.
8. John R, Webb M, Young A, Stevens PE. Unreferred chronic kidney disease: a longitudinal study. Am J Kidney Dis 2004 May;43(5):825-835.
9. Akbari A, Swedko PJ, Clark HD, Hogg W, Lemelin J, Magner P, et al. Detection of chronic kidney disease with laboratory reporting of estimated glomerular filtration rate and an educational program. Arch Intern Med 2004 Sep;164(16):1788-1792.
10. Levey AS, Bosch JP, Lewis JB, Greene T, Rogers N, Roth D; Modification of Diet in Renal Disease Study Group. A more accurate method to estimate glomerular filtration rate from serum creatinine: a new prediction equation. Ann Intern Med 1999 Mar;130(6):461-470.
11. Cockcroft DW, Gault MH. Prediction of creatinine clearance from serum creatinine. Nephron 1976;16(1):31-41.
12. Olafsson I. The human cystatin C gene promoter: functional analysis and identification of heterogeneous mRNA. Scand J Clin Lab Invest 1995 Nov;55(7):597-607.
13. Tenstad O, Roald AB, Grubb A, Aukland K. Renal handling of radiolabelled human cys C in the rat. Scand J Clin Lab Invest 1995;56:409-414 .
14. Grubb A. Diagnostic value of analysis of cystatin C and protein HC in biological fluids. Clin Nephrol 1992;38(Suppl 1):S20-S27.
15. Stickle D, Cole B, Hock K, Hruska KA, Scott MG. Correlation of plasma concentrations of cys C and creatinine to inulin clearance in a pediatric population. Clin Chem 1988;44:1334-1338.
16. Finney H, Newman DJ, Gruber W, Merle P, Price CP. Initial evaluation of cystatin C measurement by particle-enhanced immunonephelometry on the Behring nephelometer systems (BNA, BN II). Clin Chem 1997 Jun;43(6 Pt 1):1016-1022.
17. Haycock GB, Schwartz GJ, Wisotsky DH. Geometric method for measuring body surface area: a height-weight formula validated in infants, children, and adults. J Pediatr 1978 Jul;93(1):62-66.
18. Maack T, Johnson V, Kau ST, Figueiredo J, Sigulem D. Renal filtration, transport, and metabolism of low-molecular-weight proteins: a review. Kidney Int 1979 Sep;16(3):251-270.
19. Donaldson MD, Chambers RE, Woolridge MW, Whicher JT. α1-microglobulin, β 2-microglobulin and retinol binding protein in childhood febrile illness and renal disease. Pediatr Nephrol 1990 Jul;4(4):314-318.
20. Jung K, Schulze BD, Sydow K, Pergande M, Precht K, Schreiber G. Diagnostic value of low-molecular mass proteins in serum for the detection of reduced glomerular filtration rate. J Clin Chem Clin Biochem 1987 Aug;25(8):499-503.
21. Grubb A, Simonsen O, Sturfelt G, Truedsson L, Thysell H. Serum concentration of cystatin C, factor D and α 2-microglobulin as a measure of glomerular filtration rate. Acta Med Scand 1985;218(5):499-503.
22. Abrahamson M, Olafsson I, Palsdottir A, Ulvsbäck M, Lundwall A, Jensson O, et al. Structure and expression of the human cystatin C gene. Biochem J 1990 Jun;268(2):287-294.
23. Tenstad O, Roald AB, Grubb A, Aukland K. Renal handling of radiolabelled human cystatin C in the rat. Scand J Clin Lab Invest 1996 Aug;56(5):409-414.
24. Bokenkamp A, Ciarimboli G, Kilian I, Klanke B, Schurek HJ, Stolte H. Determination of the glomerular sieving coefficient in the isolated rat kidney after fixation with glutaraldehyde. J Am Soc Nephrol 1997;8(September):58A.
25. Groesbeck D, Köttgen A, Parekh R, Selvin E, Schwartz GJ, Coresh J, et al. Age, gender, and race effects on cystatin C levels in US adolescents. Clin J Am Soc Nephrol 2008 Nov;3(6):1777-1785.
26. Laterza OF, Price CP, Scott MG. Cystatin C: an improved estimator of glomerular filtration rate? Clin Chem 2002 May;48(5):699-707.
27. Randers E, Erlandsen EJ. Serum cystatin C as an endogenous marker of the renal function–a review. Clin Chem Lab Med 1999 Apr;37(4):389-395.
28. Randers E, Erlandsen EJ, Pedersen OL, Hasling C, Danielsen H. Serum cystatin C as an endogenous parameter of the renal function in patients with normal to moderately impaired kidney function. Clin Nephrol 2000 Sep;54(3):203-209.
29. Randers E, Kristensen JH, Erlandsen EJ, Danielsen H. Serum cystatin C as a marker of the renal function. Scand J Clin Lab Invest 1998 Nov;58(7):585-592.
30. Tian S, Kusano E, Ohara T, Tabei K, Itoh Y, Kawai T, et al. Cystatin C measurement and its practical use in patients with various renal diseases. Clin Nephrol 1997 Aug;48(2):104-108.
31. Herget-Rosenthal S, Trabold S, Pietruck F, Holtmann M, Philipp T, Kribben A. Cystatin C: efficacy as screening test for reduced glomerularfiltration rate. Am J Nephrol 2000 Mar-Apr;20(2):97-102.
32. Coll E, Botey A, Alvarez L, Poch E, Quintó L, Saurina A, et al. Serum cystatin C as a new marker for noninvasive estimation of glomerular filtrationrate and as a marker for early renal impairment. Am J Kidney Dis 2000 Jul;36(1):29-34.
33. Risch L, Blumberg A, Huber A. Rapid and accurate assessment of glomerular filtration rate in patients with renal transplants using serum cystatin C. Nephrol Dial Transplant 1999 Aug;14(8):1991-1996.
34. Vinge E, Lindergård B, Nilsson-Ehle P, Grubb A. Relationships among serum cystatin C, serum creatinine, lean tissue mass and glomerular filtration rate in healthy adults. Scand J Clin Lab Invest 1999 Dec;59(8):587-592.
35. Randers E, Erlandsen EJ. Serum cystatin C as an endogenous marker of the renal function–a review. Clin Chem Lab Med 1999 Apr;37(4):389-395.
36. Keevil BG, Kilpatrick ES, Nichols SP, Maylor PW. Biological variation of cystatin C: implications for the assessment of glomerular filtration rate. Clin Chem 1998 Jul;44(7):1535-1539.
37. O’Riordan SE, Webb MC, Stowe HJ, Simpson DE, Kandarpa M, Coakley AJ, et al. Cystatin C improves the detection of mild renal dysfunction in older patients. Ann Clin Biochem 2003 Nov;40(Pt 6):648-655.
38. Fliser D, Ritz E. Serum cystatin C concentration as a marker of renal dysfunction in the elderly. Am J Kidney Dis 2001 Jan;37(1):79-83.
|