Trauma is an injury to the body caused by an external force. It can result from a variety of factors, such as accidents, falls, violence, or disasters, and can lead to physical harm or psychological distress. Trauma can involve any part of the body and is classified based on the severity of the injury.1
Pediatric trauma is a significant public health problem worldwide and the most common cause of morbidity and mortality. Each year, approximately 950 000 children < 18 years die due to injury and violence.2 Additionally, trauma accounts for over 20% of all deaths in the Gulf Cooperation Council.3 Trauma—especially falls, motor vehicle collisions, and burns—contributes significantly to pediatric emergency department (ED) visits and hospital admissions.4 These injuries often lead to long-term disabilities, emphasizing the need for effective prevention and management approaches. In many cases, pediatric trauma is preventable, which underscores its importance as a public health concern.2
Despite the global burden, regional studies focusing on pediatric trauma remain limited, especially in Middle Eastern countries like Oman. Recent international studies suggest that falls and road traffic incidents are the primary mechanisms of injury in children under 15.5–7 Boys are typically at higher risk than girls, with younger children more likely to be injured at home, while adolescents are more frequently involved in outdoor or sports-related injuries.8 There is limited data available that focuses on the distinct features of trauma in the local younger population, which hampers efforts to concentrate on targeted, age-specific prevention strategies.7
Sultan Qaboos University Hospital (SQUH) is a teaching hospital with a 600-bed capacity and a large catchment area. Its emergency department comprises 25 beds and serves both adult and pediatric patients. The ED handles approximately 60 000 visits annually, of which 12 000 to 15 000 are pediatric cases. We have sought to analyze pediatric trauma cases at SQUH for over one year. This study’s primary focus was to identify common injury sites, patterns of injuries, trauma mechanisms, and their relationship to demographic factors like age and sex in children < 15 years old. This study sought to provide data to understand the burden of pediatric trauma in Oman and help improve trauma care by highlighting the risks and understanding the most common mechanisms and outcomes of pediatric injuries.
Methods
A retrospective chart review of pediatric trauma cases was conducted from January to December 2022. The inclusion criteria included patients aged 15 years or younger who presented to the Emergency Department (ED) of SQUH with a history of trauma. Children with medical conditions associated with any form of trauma were excluded from the study.
The study team designed a structured proforma to document the necessary information. Patient data were obtained from the SQUH electronic medical record system. The collected data included patient demographics, time, day, and month of presentation, source of patients, site of injury, mechanisms of trauma, type of injury, anatomical location, ED assessment, management, outcomes, and pediatric intensive care unit (PICU) admissions and length of stay.
Patients were stratified and compared based on the site of injury, mechanisms of trauma, and type of injury across three age groups: 0–5 years, 6–10 years, and 11–15 years. The sources of patients were direct arrivals to the ED, those brought by emergency medical services, or those escorted from primary health centers.
Mechanisms of injury included fall from height, impacts with fixed objects, sports injuries, motor vehicle collisions (MVC), and others. Injuries were categorized according to the body area involved: head, neck, face, chest, abdomen, pelvis, back, and extremities. The operational definition of traumatic injuries was established using the International Classification of Diseases, Tenth Revision codes. To quantify trauma severity, the Injury Severity Score (ISS) was used, with scores ranging from 1 to 75, where higher scores indicate more severe injuries. Injuries were categorized as minor (ISS: < 8), moderate (ISS: 9–15), severe (ISS: 16–24), and critical (ISS: > 24). Patient triage was conducted using the Canadian Triage and Acuity Scale, a five-level system that prioritizes care based on condition severity, ranging from level 1 (resuscitation) to level 5 (non-urgent).
Ethical approval for the study was obtained from the ethics committee of the SQU, College of Medicine and Health Sciences (REF. NO. SQU – EC/017/2023).
Statistical analysis was conducted using STATA 15 software (StataCorp. (2017). Stata Statistical Software: Release 15. College Station, TX: StataCorp LLC.). Data were presented as frequencies and mean ± SD where appropriate. Continuous variables were analyzed using the Student’s t-test, and categorical variables were analyzed using the chi-square test. A p-value < 0.05 was considered statistically significant.
Results
A total of 1750 pediatric trauma cases met the inclusion criteria during the study period. Following data screening, 107 cases with incomplete records were excluded, resulting in 1643 patients included in the final analysis. The mean age was 6.2 ± 0.1 years, with 845 (51.4%) patients aged 0–5 years, and 1064 (64.8%) were male.
More than two-thirds of the trauma cases (n = 1174, 71.5%) visited the ED during the evening or nighttime hours [Figure 1]. The majority of visits occurred on weekdays (n = 1135; 69.1%), while 508 (30.9%) occurred on weekends. Monthly patient volume averaged 136.9, with peaks noted in March and July [Figure 2]. Most patients (n = 1559; 94.9%) presented directly to the ED; only 84 (5.1%) arrived via emergency services or referral centers.
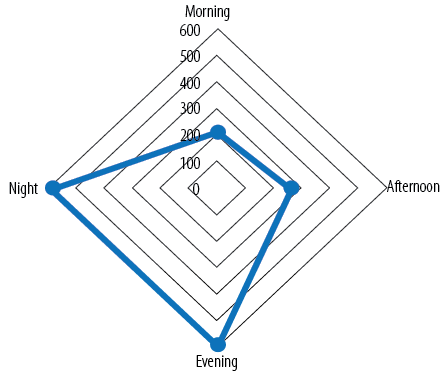 Figure 1: Radar chart of pediatric trauma patient’s emergency department arrival time plotted over parts of the day.
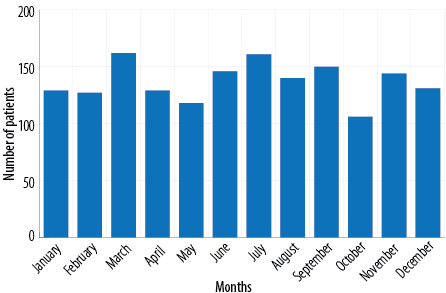 Figure 2: Distribution of pediatric trauma patients by months over study period.
The most common site of injury was the home, accounting for 1195 (72.7%) cases, followed by 142 (8.6%) on the road, and 134 (8.2%) at sports grounds. The leading mechanism of injury was fall from height, with 835 (50.8%) cases, followed by collisions with fixed objects, 200 (12.2%) cases. Sports-related injuries, 134 (8.2%) cases, were the third leading cause of trauma. The most frequent injury types were lacerations (32.3%), followed by soft tissue injuries (19.3%), and fractures (16.6%). The face (33.0%) and upper extremities (25.3%) were the most frequently injured anatomical regions [Table 1].
Table 1: Demographics, source of patients, and injury characteristics among study population
(N = 1643).
|
Age, mean ± SD, years
|
6.2 ± 0.1
|
|
Age, years
|
|
|
|
0–5
|
845 (51.4)
|
|
6–10
|
496 (30.2)
|
|
11–15
|
302 (18.4)
|
|
Sex
|
|
|
Male
|
1064 (64.8)
|
|
Female
|
579 (35.2)
|
|
Source of patients
|
|
|
Direct arrival to ED
|
1559 (94.9)
|
|
Brought by EMS
|
47 (2.9)
|
|
Escorted from LHC
|
37 (2.2)
|
|
Site of injury
|
|
|
Home
|
1195 (72.7)
|
|
Street
|
53 (3.3)
|
|
School
|
51 (3.1)
|
|
Road
|
142 (8.6)
|
|
Sports
|
134 (8.2)
|
|
Park/public place
|
68 (4.1)
|
|
Mechanisms of injury
|
|
|
Fall from height
|
835 (50.8)
|
|
MVC-pedestrian
|
47 (2.9)
|
|
MVC-passenger
|
115 (7.0)
|
|
Burn
|
17 (1.0)
|
|
Assault
|
5 (0.3)
|
|
Animal bite
|
14 (0.8)
|
|
Drowning
|
10 (0.6)
|
|
Electric shock
|
3 (0.2)
|
|
Falling of object on body part
|
62 (3.8)
|
|
Hit over fixed object
|
200 (12.2)
|
|
Needle prick/knife-cut
|
33 (2.0)
|
|
Foreign body
|
87 (5.3)
|
|
Pulled elbow
|
36 (2.2)
|
|
Sports injury
|
134 (8.2)
|
|
Finger entrapped in door
|
45 (2.7)
|
|
Type of injury
|
|
|
Laceration
|
531 (32.3)
|
|
Fracture/dislocation
|
273 (16.6)
|
|
Crush injury
|
18 (1.1)
|
|
Penetrating injury
|
27 (1.6)
|
|
Soft tissue injury
|
316 (19.3)
|
|
Burn
|
17 (1.0)
|
|
Contusion
|
206 (12.5)
|
|
Foreign body
|
87 (5.3)
|
|
Blunt injury
|
114 (7.0)
|
|
Drowning
|
10 (0.6)
|
|
Polytrauma
|
44 (2.7)
|
|
Anatomic location of injury
|
|
|
Head and neck
|
300 (18.3)
|
|
Face
|
543 (33.0)
|
|
Abdomen, pelvis, and genitalia
|
45 (2.7)
|
|
Upper extremity
|
416 (25.3)
|
|
Lower extremity
|
254 (15.5)
|
|
Chest and back
|
41 (2.5)
|
ED: emergency department; EMS: emergency medical services; LHC: local health center; MVC: motor vehicle collision.
Younger children (0–5 years) were more prone to injuries at home (88.3%) compared to those aged 6–10 years (63.5%) and 11–15 years (44.4%), whereas adolescents (11–15 years) were more frequently injured on the road (17.6% vs. 8.9% for 6–10 years and 5.3% for 0–5 years) and at sports grounds (26.5% vs. 9.9% for 6–10 years and 0.6% for 0–5 years). Those children sustaining injuries on the street had a higher proportion within 6–10 years (6.5%) than those aged 11–15 years (3.6%) and 0–5 years (1.2%). These differences were statistically significant.
Younger patients (0–5 years) had higher rates of falls (57.4% vs. 49.5% for 6–10 years and 34.8% for 11–15 years) and foreign bodies (8.0% vs. 3.6% for 6–10 years and 0.3% for 11–15 years), but lower rates of assault (0.0% vs. 0.4% for 6–10 years and 1.0% for 11–15 years). Older children (11–15 years) had higher rates of sports-related injuries (26.5% vs. 9.9% for 6–10 years and 0.6% for 0–5 years) and MVC-passenger injuries (13.9% vs. 6.7% for 6–10 years and 4.7% for 0–5 years) compared to younger children with p < 0.001. Lacerations and blunt injuries were more common in the younger study population (0–5 years: 37.3% and 9.1%) compared to those aged 6–10 years (31.7% and 5.2%) and 11–15 years (19.6% and 3.6%). Conversely, fractures and soft tissue injuries were more prevalent in the oldest age group (11–15 years: 27.8% and 25.8%) compared to children aged 6–10 years (21.6% and 18.8%) and 0–5 years (9.7% and 17.2%) [Table 2].
Table 2: Characteristics of pediatric trauma patients according to age categories.
|
Site of injury
|
|
|
|
|
|
Home
|
746 (88.3)
|
315 (63.5)
|
134 (44.4)
|
|
|
Street
|
10 (1.2)
|
32 (6.5)
|
11 (3.6)
|
|
|
School
|
12 (1.4)
|
26 (5.2)
|
13 (4.3)
|
0.001
|
|
Road
|
45 (5.3)
|
44 (8.9)
|
53 (17.6)
|
|
|
Sports ground
|
5 (0.6)
|
49 (9.9)
|
80 (26.5)
|
|
|
Park/public places
|
27 (3.2)
|
30 (6.0)
|
11 (3.6)
|
|
|
Mechanisms of injury
|
|
|
|
|
|
Fall from height
|
485 (57.4)
|
245 (49.5)
|
105 (34.8)
|
|
|
MVC-pedestrian
|
11 (1.3)
|
21 (4.2)
|
15 (5.0)
|
|
|
MVC-passenger
|
40 (4.7)
|
33 (6.7)
|
42 (13.9)
|
|
|
Burn
|
9 (1.1)
|
3 (0.6)
|
5 (1.7)
|
|
|
Assault
|
0 (0.0)
|
2 (0.4)
|
3 (1.0)
|
|
|
Animal bite
|
5 (0.6)
|
6 (1.2)
|
3 (1.0)
|
|
|
Drowning
|
8 (0.9)
|
1 (0.2)
|
1 (0.3)
|
0.001
|
|
Electric shock
|
1 (0.1)
|
2 (0.4)
|
0 (0.0)
|
|
|
Falling of objects
|
30 (3.6)
|
19 (3.8)
|
13 (4.3)
|
|
|
Hit over fixed object
|
105 (12.4)
|
68 (13.7)
|
27 (8.9)
|
|
|
Needle prick
|
17 (2.0)
|
13 (2.6)
|
3 (1.0)
|
|
|
Foreign body
|
68 (8.0)
|
18 (3.6)
|
1 (0.3)
|
|
|
Pulled elbow
|
34 (4.0)
|
2 (0.4)
|
0 (0.0)
|
|
|
Sport injury
|
5 (0.6)
|
49 (9.9)
|
80 (26.5)
|
|
|
Finger entrapped in door
|
27 (3.3)
|
14 (2.8)
|
4 (1.3)
|
|
|
Type of injury
|
|
|
|
|
|
Laceration
|
315 (37.3)
|
157 (31.7)
|
59 (19.6)
|
|
|
Fracture/dislocation
|
82 (9.7)
|
107 (21.6)
|
84 (27.8)
|
|
|
Crush injury
|
11 (1.3)
|
7 (1.4)
|
0 (0.0)
|
|
|
Penetrating injury
|
15 (1.8)
|
10 (2.0)
|
2 (0.7)
|
|
|
Soft tissue injury
|
145 (17.2)
|
93 (18.8)
|
78 (25.8)
|
|
|
Burn
|
10 (1.2)
|
2 (0.4)
|
5 (1.7)
|
0.001
|
|
Contusion
|
93 (11.0)
|
65 (13.1)
|
48 (15.9)
|
|
|
Foreign body
|
68 (8.0)
|
18 (3.6)
|
1 (0.3)
|
|
|
Blunt injury
|
77 (9.1)
|
26 (5.2)
|
11 (3.6)
|
|
|
Drowning
|
8 (0.9)
|
1 (0.2)
|
1 (0.3)
|
|
MVC: motor vehicle collision.
Females were more frequently injured at home (76.0%) and had a higher incidence of fall-related injuries (52.9%) and pulled elbows (3.3%). Males were more commonly injured during sports (11.0%) and from assaults (0.5%) or fixed object collisions (13.2%). While lacerations and fractures were more common in males, females had higher rates of contusions and crush injuries. However, differences in injury types by sex were not statistically significant (p = 0.173) [Table 3].
Table 3: Characteristics of pediatric trauma patients according to sex.
|
Site of injury
|
|
|
|
|
Home
|
755 (71.0)
|
440 (76.0)
|
|
|
Street
|
39 (3.7)
|
14 (2.4)
|
|
|
School
|
35 (3.3)
|
16 (2.8)
|
0.001
|
|
Road
|
76 (7.1)
|
66 (11.4)
|
|
|
Sports ground
|
117 (11.0)
|
17 (2.9)
|
|
|
Park/public places
|
42 (3.9)
|
26 (4.5)
|
|
|
Mechanisms of injury
|
|
|
|
|
Fall from height
|
529 (49.7)
|
306 (52.9)
|
|
|
MVC-pedestrian
|
34 (3.2)
|
13 (2.2)
|
|
|
MVC-passenger
|
56 (5.3)
|
59 (10.2)
|
|
|
Burn
|
14 (1.3)
|
3 (0.5)
|
|
|
Assault
|
5 (0.5)
|
0 (0.0)
|
|
|
Animal bite
|
10 (0.9)
|
4 (0.7)
|
|
|
Drowning
|
6 (0.6)
|
4 (0.7)
|
0.001
|
|
Electric shock
|
1 (0.1)
|
2 (0.3)
|
|
|
Falling of objects
|
41 (3.8)
|
21 (3.6)
|
|
|
Hit over fixed object
|
141 (13.2)
|
59 (10.2)
|
|
|
Needle prick
|
19 (1.8)
|
14 (2.4)
|
|
|
Foreign body
|
53 (5.0)
|
34 (5.9)
|
|
|
Pulled elbow
|
17 (1.6)
|
19 (3.3)
|
|
|
Sport injury
|
117 (11.0)
|
17 (2.9)
|
|
|
Finger entrapped in door
|
21 (2.0)
|
24 (4.2)
|
|
|
Type of injury
|
|
|
|
|
Laceration
|
354 (33.3)
|
177 (30.6)
|
|
|
Fracture/dislocation
|
189 (17.8)
|
84 (14.5)
|
|
|
Crush injury
|
7 (0.6)
|
11 (1.9)
|
|
|
Penetrating injury
|
16 (1.5)
|
11 (1.9)
|
|
|
Soft tissue injury
|
204 (19.2)
|
112 (19.3)
|
0.173
|
|
Burn
|
13 (1.2)
|
4 (0.7)
|
|
|
Contusion
|
121 (11.4)
|
85 (14.7)
|
|
|
Foreign body
|
53 (4.9)
|
34 (5.9)
|
|
|
Blunt injury
|
72 (6.8)
|
42 (7.2)
|
|
|
Drowning
|
6 (0.6)
|
4 (0.7)
|
|
MVC: motor vehicle collision.
During the ED assessment, one (0.1%) patient was declared dead on arrival. Among the patients assessed, 58.7% received a Canadian Triage and Acuity Scale yellow triage code, indicating their conditions were urgent but stable enough to wait 30 minutes for treatment. The ISS revealed that most injuries (65.7%) were classified as minor with scores < 8. Most patients (98.4%) had a normal Glasgow Coma Scale. The trauma patients who had abnormal Glasgow Coma Scale and severe or critical ISS (≥16) were involved in an MVC, falling from height, or struck by an object.
Diagnostic imaging, including X-ray, CT scan, and sonography for trauma, was performed on 733 (44.6%) patients, with 55% of these imaging studies revealing positive trauma-related findings. Emergency physicians treated 68.0% of the patients, while 32.0% required specialist care from trauma, orthopedic, neurosurgery, pediatric surgery, ENT, ophthalmology, and maxillofacial teams. Common interventions included a 4–6-hour observation period for minor injuries (29.8%). Systemic analgesia was administered in 18.2% of patients. Fracture management involved the application of back slabs for 14.3% of patients and reduction under sedation for 4.6%. Wound care included treating lacerations with skin adhesive (13.4%), sutures (10.3%), and dressings (2.7%). The majority (n = 1467, 89.3%) of patients were treated and discharged from the ED, while 111 (6.7%) required hospital admission, and 64 (3.9%) were referred to specialized trauma centers [Table 4].
Table 4: Emergency department assessment and management of study population (N = 1643).
|
ED triage code*
|
|
|
Immediate (1-blue)
|
16 (1.0)
|
|
15 min (2-red)
|
106 (6.5)
|
|
30 min (3-yellow)
|
965 (58.7)
|
|
60 min (4-green)
|
556 (33.8)
|
|
GCS score
|
|
|
15
|
1617 (98.4)
|
|
< 15
|
26 (1.6)
|
|
Injury severity score
|
|
|
Minor (< 8)
|
1080 (65.7)
|
|
Moderate (9–15)
|
460 (28.0)
|
|
Severe (16–24)
|
68 (4.2)
|
|
Critical (> 24)
|
35 (2.1)
|
|
Imaging performed†
|
|
|
Yes
|
733 (44.6)
|
|
No
|
910 (55.4)
|
|
Results of imaging‡ (n = 733)
|
|
|
Positive trauma related findings
|
403 (55.0)
|
|
Negative trauma related findings
|
330 (45.0)
|
|
Interventions
|
|
|
Observation
|
490 (29.8)
|
|
Systemic analgesia
|
299 (18.2)
|
|
Wound management
|
434 (26.4)
|
|
Fracture management
|
311 (18.9)
|
|
Intubation
|
26 (1.7)
|
|
Others
|
82 (5.0)
|
|
Disposition and outcome
|
|
|
Brought dead
|
1 (0.1)
|
|
Discharged from ED
|
1467 (89.3)
|
|
Admission
|
111 (6.7)
|
GCS: Glasgow Coma Scale; ED: emergency department.
*Canadian Triage and Acuity Scale (CTAS) Level 1 (resuscitation, blue): immediate care required for life-threatening conditions. Level 2 (emergent, red): urgent care within 15 minutes needed for potentially serious conditions. Level 3 (urgent, yellow): assessment required within 30 minutes for serious conditions. Level 4 (less urgent, green): stable conditions requiring medical attention within 60 minutes. †X-ray, CT scan and sonography; ‡fractures, pneumothorax, intracranial hemorrhage, and solid organ lacerations.
Among 1643 participants, 33 (2.0%) had significant clinical outcomes. No statistically significant differences in age or sex were noted between the groups. PICU admissions were more frequent for children involved in MVC (45.4% vs. 10.3%), struck by falling objects (6.1% vs. 5.1%), and with polytrauma (54.5% vs. 12.8%), compared to those in ward or high-dependency units. Critical triage codes (blue: 42.4% vs. 1.3% and red: 45.4% vs. 35.9%) and severe (48.5% vs. 5.1%) or critical (33.3% vs. 1.3%) ISS correlated with more severe outcomes (p = 0.001). These patients often required intubation, laparotomy, and craniotomy with more extended hospital stays (10.9 vs. 2.1 days; p = 0.001) [Table 5].
Table 5: Characteristics of pediatric trauma patients upon admission.
|
Age, mean ± SD, years
|
|
5.9 ± 0.4
|
5.9 ± 0.7
|
0.520
|
|
Sex
|
|
|
|
|
|
Male
|
71 (64.0)
|
48 (61.5)
|
23 (69.7)
|
0.701
|
|
Female
|
40 (36.0)
|
30 (38.5)
|
10 (30.3)
|
|
|
Mechanisms of injury
|
|
|
|
|
|
Fall from height
|
43 (38.8)
|
35 (44.9)
|
8 (24.2)
|
|
|
Hit over fixed object
|
6 (5.4)
|
4 (5.1)
|
2 (6.1)
|
|
|
MVC-passenger
|
23 (20.7)
|
8 (10.3)
|
15 (45.4)
|
0.001
|
|
Falling of object
|
6 (5.4)
|
4 (5.1)
|
2 (6.1)
|
|
|
MVC-pedestrian
|
15 (13.5)
|
11 (14.1)
|
4 (12.1)
|
|
|
Drowning
|
4 (3.6)
|
2 (2.6)
|
2 (6.1)
|
|
|
Others
|
14 (12.6)
|
14 (17.9)
|
0 (0.0)
|
|
|
Type of injury
|
|
|
|
|
|
Laceration
|
20 (18.0)
|
15 (19.2)
|
5 (15.2)
|
|
|
Fracture
|
21 (19.0)
|
20 (25.7)
|
1 (3.0)
|
|
|
Contusion
|
6 (5.4)
|
5 (6.4)
|
1 (3.0)
|
|
|
Blunt injury
|
13 (11.7)
|
10 (12.8)
|
3 (9.1)
|
0.001
|
|
Polytrauma
|
28 (25.2)
|
10 (12.8)
|
18 (54.5)
|
|
|
Penetrating injury
|
4 (3.6)
|
1 (1.3)
|
3 (9.1)
|
|
|
Drowning
|
4 (3.6)
|
2 (2.6)
|
2 (6.1)
|
|
|
Others
|
15 (13.5)
|
15 (19.2)
|
0 (0.0)
|
|
|
ED triage code
|
|
|
|
|
|
Immediate (1-blue)
|
15 (13.6)
|
1 (1.3)
|
14 (42.4)
|
|
|
15 min (2-red)
|
43 (38.7)
|
28 (35.9)
|
15 (45.4)
|
0.001
|
|
30 min (3-yellow)
|
43 (38.7)
|
39 (50.0)
|
4 (12.2)
|
|
|
60 min (4-green)
|
10 (9.0)
|
10 (12.8)
|
0 (0.0)
|
|
|
Injury severity score†
|
|
|
|
|
|
Minor (< 8)
|
29 (26.2)
|
29 (37.2)
|
0 (0.0)
|
|
|
Moderate (9–15)
|
50 (45.0)
|
44 (56.4)
|
6 (18.2)
|
0.001
|
|
Severe (16–24)
|
20 (18.0)
|
4 (5.1)
|
16 (48.5)
|
|
|
Critical (> 24)
|
12 (10.8)
|
1 (1.3)
|
11 (33.3)
|
|
|
Interventions*
|
|
|
|
|
|
Observation
|
38 (34.2)
|
35 (44.9)
|
3 (9.1)
|
|
|
Intubation
|
26 (23.4)
|
0 (0.0)
|
26 (78.8)
|
|
|
Chest tube
|
1 (0.9)
|
0(0.0)
|
1 (3.1)
|
|
|
Exploratory laparotomy
|
4 (3.6)
|
1 (1.3)
|
3 (9.1)
|
|
|
Fracture management
|
27 (24.3)
|
21 (26.9)
|
6 (18.2)
|
|
|
Craniotomy
|
6 (5.4)
|
0 (0.0)
|
6 (18.2)
|
|
|
Others
|
22 (19.8)
|
21 (26.9)
|
1 (3.1)
|
|
MVC: motor vehicle collision; HDU: high-dependency unit; PICU: pediatric intensive care unit; ISS injury severity score.
†Minor: not life-threatening and require minimal medical intervention. Moderate: may require significant medical attention but are not immediately life-threatening. Severe: life-threatening and may require intensive care or surgical intervention. Critical: denotes injuries that are life-threatening or unsurvivable often associated with multi-system trauma. *11 patient had multiple procedures.
Discussion
This study presents valuable insights into pediatric trauma patterns at SQUH. It highlights key injury mechanisms, types, and demographic correlations while contributing to the regional body of knowledge on pediatric trauma.
This study identified specific injury types based on age and gender, revealing that a significant number (51.4%) of younger children (0–5 years) were more prone to injuries, with males being injured at twice the rate of females (2:1 ratio). However, the overall pattern of injury types across genders did not show statistically significant differences, which may suggest that gender-based differences are more activity-related than physiological.9 These results are consistent with other epidemiological studies on pediatric trauma conducted in the Gulf Cooperation Council and sub-Saharan Africa regions.10–12
In this study, the primary trauma sites for both sexes were at home (72.7%) and on the road (8.6%). However, a higher percentage of adolescent males (11–15 years) were injured on sports grounds. This aligns with the literature, which associates this age group with increased participation in organized sports and outdoor activities, resulting in a higher incidence of injuries.13,14 Road traffic accidents, though less frequent in this study, remain a notable cause of trauma in adolescents, which corresponds to findings from other regions where traffic injuries are a common concern in this age group.15
Our findings align with previous studies that have identified falls as the leading cause of pediatric trauma, accounting for 50.8% of cases in this study. This is consistent with global reports, which indicate that falls constitute a significant proportion of pediatric injuries, particularly among younger children.2,16–18 Smaller children are vulnerable to falls due to their developmental stage, lack of coordination, and natural tendency to explore their surroundings. This highlights the need for focused preventive measures within homes, including child-friendly environments, to reduce fall risks.
Lacerations (32.3%) and soft tissue injuries (19.3%) were the most frequent types of injuries, with the face (33.0%) and upper extremities (25.3%) being the most commonly affected. These results are consistent with other studies, which have identified lacerations and soft tissue injuries as the leading types of trauma in pediatric populations.19,20 The predominance of these injury types showed the relatively minor nature of most pediatric trauma cases, many of which were caused by low-energy mechanisms. The high number of facial and upper extremity injuries likely reflects the vulnerability of these regions in common mechanisms of injury, such as falls and sports-related trauma.21,22
Interestingly, long bone fractures were more common in adolescents than in younger children. One possible explanation for this difference is that older children are more likely to engage in vigorous activities, such as sports or road traffic accidents, leading to more severe injuries like fractures. Additionally, younger children’s bones are more flexible and less likely to break than those of adolescents.23
According to the study, most (89.3%) patients were treated and discharged from the ED, indicating a pattern of non-severe injuries that could be managed with conservative treatments, such as wound closure using Dermabond or suturing, and fracture management using back slabs or reduction under sedation. This matches with other studies, showing that most pediatric trauma cases involve minor injuries that do not require surgical intervention.24,25 However, a small proportion (6.7%) of patients required hospital admission, and 2.0% experienced significant clinical outcomes, such as admission to the PICU. Patients admitted to the PICU were associated with severe trauma mechanisms, including motor vehicle collisions and polytrauma, emphasizing the importance of traffic safety measures for children.9 Preventive measures, such as enforcing child seatbelt use, promoting pedestrian safety, and implementing sports safety protocols, likely reduced the severity of injuries.26 Overall, the results of this study are consistent with global trends in pediatric trauma, underscoring the need for targeted preventive strategies to reduce the incidence and severity of injuries in children.27
To the best of our knowledge, this is the first study with a thorough understanding of pediatric trauma in this context. There were limitations in this study. The first limitation was its retrospective nature and reliance on previously recorded medical charts and electronic data. This can lead to incomplete or inaccurate information due to missing data or variability in clinical documentation. Second, the study overlooked parental supervision, or environmental factors, which can significantly influence the incidence and type of injuries among children. Third, follow-up data for patients with severe traumatic injuries were missing. Lastly, the study was conducted at a single tertiary care hospital. Therefore, the results may not generalize to other regions or healthcare settings across Oman or the Middle East.
Conclusion
This study provides valuable information about the patterns of pediatric trauma and identifies falls from height as the most common mechanism of injury, particularly among younger children. Males were more frequently affected with lacerations and soft tissue injuries, which were the most common injury types. Adolescents were more prone to road traffic and sports-related injuries. The results also highlight the importance of focused safety measures—especially at home, on the road, and during recreational activities—to prevent injuries in children. Future research should focus on intervention strategies and long-term outcomes, and include other healthcare settings to understand pediatric trauma and prevention methods better.
Disclosure
The authors declare no conflict of interest and no funding received for this study.
references
- 1. World Health Organization. Injuries and violence. 2024 [cited 2024 September 5]. Available from: https://www.who.int/news-room/fact-sheets/detail/injuries-and-violence.
- 2. Peden M, Oyegbite K, Ozanne-Smith J, Hyder AA, Branche C, Rahman AF, et al, editors. World report on child injury prevention. Geneva: World Health Organization; 2008.
- 3. Boutayeb A, Serghini M. Health indicators and human development in the Arab region. Int J Health Geogr 2006;5:61.
- 4. Centers for Disease Control and Prevention. National Center for Injury Prevention and Control. National action plan for child injury prevention. 2012 [cited 2024 September 5]. Available form: https://www.childrenssafetynetwork.org/sites/default/files/National_Action_Plan_for_Child_Injury_Prevention.pdf.
- 5. Alomani H, Fareed A, Ibrahim H, Shaltoot A, Elhalawany A, Alhajjaj M, et al. Pediatric trauma at a single center in the Qassim region of Saudi Arabia. Ann Saudi Med 2021;41(3):165-170.
- 6. Nooyi SC, Sonaliya KN, Dhingra B, Roy RN, Indumathy P, Soni RK, et al; For ICMR Taskforce on Childhood Injuries. Descriptive epidemiology of unintentional childhood injuries in India: an ICMR taskforce multisite study. Indian Pediatr 2021 Jun;58(6):517-524.
- 7. Al-Balushi H, Al-Kalbani A, Al-Khwaldi T, Al-Suqri S, Al-Maniri A, Alazri M, et al. Injuries presented at a primary care setting in Oman. Oman Med J 2012 Nov;27(6):486-490.
- 8. Zhang F, Huang L, Singichetti B, Li H, Sullivan L, Yang JG. Sex and age differences in hospitalized pediatric traumatic brain injury. Pediatr Int 2019 Sep;61(9):904-912.
- 9. West BA, Rudd RA, Sauber-Schatz EK, Ballesteros MF. Unintentional injury deaths in children and youth, 2010-2019. J Safety Res 2021 Sep;78:322-330.
- 10. Almalki MM, Almalki ME, Alsulaimani N, Tariq S, Alqahtani T, Baalaraj F, et al. Epidemiology of pediatric trauma in Makkah, Kingdom of Saudi Arabia: an observational cohort study. Saudi Med J 2023 Aug;44(8):808-814.
- 11. Alyafei KA, Toaimah F, El Menyar A, Al Thani H, Youssef B, Mollazehi M, et al. Analysis of pediatric trauma data from a hospital based trauma registry in Qatar. Int J Crit Illn Inj Sci 2015;5(1):21-26.
- 12. Kiser MM, Samuel JC, Mclean SE, Muyco AP, Cairns BA, Charles AG. Epidemiology of pediatric injury in Malawi: burden of disease and implications for prevention. Int J Surg 2012;10(10):611-617.
- 13. Jalalvandi F, Arasteh P, Safari Faramani R, Esmaeilivand M. Epidemiology of pediatric trauma and its patterns in western Iran: a hospital based experience. Glob J Health Sci 2015;8(6):139-146.
- 14. World Health Organization. Preventing injuries and violence: an overview. 2021 [cited 2024 September 15]. Available from: https://iris.who.int/bitstream/handle/10665/361331/9789240047136-eng.pdf?sequence=1.
- 15. Centers for Disease Control and Prevention. Childhood injuries: leading causes of injury. [cited 2024 September 15]. Available from: https://wisqars.cdc.gov/animated-leading-causes/.
- 16. Petroze RT, Martin AN, Ntaganda E, Kyamanywa P, St-Louis E, Rasmussen SK, et al. Epidemiology of paediatric injuries in Rwanda using a prospective trauma registry. BJS Open 2020 Feb;4(1):78-85.
- 17. Krug EG, Sharma GK, Lozano R. The global burden of injuries. Am J Public Health 2000 Apr;90(4):523-526.
- 18. Mehmood A, Agrawal P, Allen KA, Al-Kashmiri A, Al-Busaidi A, Hyder AA. Childhood injuries in Oman: retrospective review of a multicentre trauma registry data. BMJ Paediatr Open 2018;2(1):e000310.
- 19. Parslow RC, Morris KP, Tasker RC, Forsyth RJ, Hawley CA; UK Paediatric Traumatic Brain Injury Study Steering Group; Paediatric Intensive Care Society Study Group. Epidemiology of traumatic brain injury in children receiving intensive care in the UK. Arch Dis Child 2005 Nov;90(11):1182-1187.
- 20. Ozdemir S, Akça HŞ, Algın A, Kokulu K, Ozkan A. Characteristics of school injuries presenting to the emergency department. Avicenna J Med 2022;12(2):61-66.
- 21. Flavin MP, Dostaler SM, Simpson K, Brison RJ, Pickett W. Stages of development and injury patterns in the early years: a population-based analysis. BMC Public Health 2006;6:187.
- 22. Onyemaechi NO, Bisi-Onyemaechi AI, Nduagubam OC. Epidemiology and pattern of paediatric injuries in a developing country: an analysis of 170 injuries. Malawi Med J 2020 Jun;32(2):95-100.
- 23. Engstrom Z, Wolf O, Hailer YD. Epidemiology of pediatric femur fractures in children: the Swedish fracture register. BMC Musculoskelet Disord 2020;21(1):796.
- 24. Boyce AM, Gafni RI. Approach to the child with fractures. J Clin Endocrinol Metab 2011 Jul;96(7):1943-1952.
- 25. Krishnamoorthy V, Ramaiah R, Bhananker SM. Pediatric burn injuries. Int J Crit Illn Inj Sci 2012 Sep;2(3):128-134.
- 26. Bazarian JJ, McClung J, Cheng YT, Flesher W, Schneider SM. Emergency department management of mild traumatic brain injury in the USA. Emerg Med J 2005 Jul;22(7):473-477.
- 27. Dowd MD, Keenan HT, Bratton SL. Epidemiology and prevention of childhood injuries. Crit Care Med 2002 Nov;30(11 Suppl):S385-S392.