Type 2 diabetes mellitus (T2DM) is a leading public health concern globally and a well-known cause of premature death. It is primarily a silent disease that leads to several complications if the affected person remains undiagnosed.1 Globally, 49.7% of all diabetes cases in adults are estimated to be undiagnosed, ranging from 69.2% in Africa, 57% in Asia, and 38% in Europe and North America.2 An estimated 76.5% of all undiagnosed cases are in low- and middle-income countries.2 Based on the Oman World Health Survey 2008 (WHS 2008), the crude prevalence of T2DM in Oman is high (12.3%), with 40.9% undiagnosed.3
The gold standard diagnostic test for T2DM is through biochemical blood tests, including both fasting blood glucose and oral glucose tolerance test (OGTT).4,5 However, both tests are invasive, expensive, and less feasible for population-based screening.6,7 Therefore, finding a simple, cost-effective, non-invasive tool to screen for blood sugar to detect high-risk individuals for T2DM is imperative.5,6
Multivariable diabetes risk scores calculate the risk of developing diabetes in healthy people.6 Presently, many risk scores have been developed and validated in different inhabitants, showing good discriminatory capability in populations either for detection of undiagnosed diabetes or the identification of a high-risk group.8 A previous effort to develop a tool to identify risk scores for T2DM in Oman was led in the 1991 National Diabetes Survey data.9 However, that tool did not contain variables on physical inactivity or dietary intake of fruits and vegetables.9 The high prevalence of undiagnosed diabetes in Oman in the 2008 national survey compelled us to conduct a further study in this field.10 The aim of this study was to develop a valid and updated risk scores assessment tool for undiagnosed T2DM in the Omani population using the WHS 2008 dataset.
Methods
We used data from two cross-sectional surveys: the WHS 2008 as the development model, and the 2006 Sur Healthy Lifestyle Study as the validation model.11,12 Sur is a city in Oman located about 200 km east of Muscat, Oman’s capital. The WHS 2008 contained 2720 subjects and the Sur Survey 1355 subjects after excluding individuals with missing relevant data. The response rate in the former study was 86.3% and in the latter 80.8%. Details of sampling methods for both surveys have been published previously.11,12
Both surveys used the World Health Organisation (WHO) criteria (1999) to identify prevalent T2DM (i.e., fasting blood glucose ≥ 7 mmol/L).13 Additionally, both surveys collected similar data, which included age, sex, education, height, weight, smoking habits, dietary intake, history of hypertension, and physical activity. Residential area information was only collected in the WHS 2008.11
The study included Omani nationals aged ≥ 20 years in the WHS 2008, which resulted in a sample size of 2720 subjects after excluding individuals with missing data.11 Eleven independent variables were analyzed in categories to develop the model. The model included gender (male or female), age (< 40 years or ≥ 40 years), education (ever having attended school or not), residence (urban or rural), marital status (single, married, divorced, or widowed), and tobacco use (current user, ex-user or non- user). Place of residence was based on the standard definition coined by Oman’s National Centre for Statistics and Information (NCSI): urban areas (in which 75% of Omanis live) included four districts of the capital city and centers of other districts with a stable locality population of 2500+ persons and at least three basic services (a government school, public electricity, public dispensary, or telephone services).14 Current tobacco use was defined as smoking, sniffing, or chewing any tobacco products at the time of the survey. Ex-users were those who were not using tobacco products at the time of the survey but used them in the past, and non-users were subjects who reported to have never used any form of tobacco products in their lifetime.
Obesity measures included body mass index (BMI, kg/m2), which is calculated by dividing weight in kilograms by the square of height in meters (BMI: normal, < 25; overweight, 25–29.9; and obese, ≥ 30), and waist circumference (WC) (for males, WC < 102 or ≥ 102 cm, and for females, WC < 88 or ≥ 88 cm). In addition, the presence of hypertension was defined as isolated systolic hypertension ≥ 140 mmHg, isolated diastolic hypertension ≥ 90 mmHg, or combined hypertension ≥ 140/90 mmHg, or on medication for high blood pressure, and calculated by an average of three readings. Physical activity was defined as insufficient (< 150 minutes per week spent on walking/moderate activity/vigorous activity), sufficient (> 150 minutes/week walking/moderate activity/vigorous activity), or no physical activity, and fruit and vegetable intake was measured as < 5 or ≥ 5 servings per day). T2DM (outcome) as a dependent variable was defined as fasting blood glucose ≥ 7 mmol/L, as per WHO guidelines,13 or self-reported diabetes diagnosed by a physician.
Multivariable logistic regression was conducted on data from the WHS 2008, with T2DM (outcome) as a dependent variable, and risk factors with a p-value < 0.100 were included as initial independent variables. The backward stepwise elimination method was used to formulate the predicted model. Each β-coefficient was multiplied by the same factor of five to reveal the different weights that each independent variable has with regard to the dependent variable. The score number was rounded to the nearest complete integer, and the individual risk score was the sum of the scores of their variables. Adjusted odds ratio (aOR) as a measure of association with 95% confidence intervals (CIs) were determined.
The receiver operating characteristic (ROC) curve was used to evaluate the discrimination of the model developed. This curve plots the sensitivity against 1-specificity (false-positive rate), and the area under the curve (AUC) is generally stated. The greater AUC is, the more accurate the test.6,15 A model with perfect discriminative ability has an AUC of 1.0, while an AUC of 0.5 provides no better discrimination than chance. We also used the same method to assess our score discrimination ability by calculating the sensitivity and specificity of the score. Additionally, we used the external dataset from the Sur Healthy Lifestyle Survey 2006 cohort to evaluate and validate the discriminatory ability of the developed model by calculating sensitivity, specificity, and the AUC.12
To compare the performance of the developed model derived from this study with the Omani,9 Finnish,16 Kuwaiti,17 and Saudi18 risk scores among Omanis, the logistic regression equations from these models, were applied on the WHS 2008 and the Sur 2006 cohorts’ dataset of Oman.11,12 The data were analyzed using Stata software (version 13, Stata Corp, Texas, USA). Stata commands lroc and roctab were used to calculate the sensitivity and the specificity for each score performance using the cutoffs points proposed by the original publications.
Results
The demographic and clinical characteristics of the study participants in WHS 2008 are shown in Table 1. Approximately half of the participants were female (52.6%, n = 1430), and nearly two-thirds belonged to the 20–39 age group. There were significant differences in terms of clinical characteristics between males and females, such as hypertension, BMI, WC, physical activity, and tobacco use status (p < 0.001).
Table 1: Baseline demographic and clinical characteristic of participants in the World Health Survey 2008 and Sur Healthy Life Survey 2006.
|
Age group |
|
20–39 |
776 (60.2) |
858 (60.0) |
373 (63.1) |
546 (71.5) |
|
40– 59 |
324 (25.1) |
408 (28.5) |
159 (26.9) |
177 (23.2) |
|
≥ 60 |
190 (14.7) |
164 (11.5) |
59 (10.0) |
41 (5.4) |
|
Education |
|
Yes |
965 (74.8) |
854 (59.7) |
533 (90.2) |
604 (79.2) |
|
No |
325 (25.2) |
576 (40.3) |
58 (9.8) |
159 (20.8) |
|
Marital status |
|
Single |
394 (30.5) |
235 (16.4) |
184 (31.1) |
211 (27.6) |
|
Married |
836 (64.8) |
929 (65.0) |
396 (67.0) |
441 (57.7) |
|
Divorced/separated |
34 (2.6) |
81 (5.7) |
8 (1.4) |
55 (7.2) |
|
Widowed |
26 (2.0) |
185 (12.9) |
3 (0.5) |
57 (7.5) |
|
Residence |
|
|
|
|
|
Rural |
610 (47.3) |
651 (45.5) |
- |
- |
|
Urban |
680 (52.7) |
779 (54.5) |
- |
- |
|
Diabetes status |
|
No |
1125 (87.2) |
1280 (89.5) |
518 (87.6) |
648 (84.8) |
|
Yes |
165 (12.8) |
150 (10.5) |
73(12.3) |
116 (15.2) |
|
Isolated systolic hypertension |
|
No |
785 (61.3) |
1105 (77.8) |
529 (89.5) |
718 (94.0) |
|
Yes |
495 (38.7) |
316 (22.2) |
62 (10.5) |
46 (6.0) |
|
Isolated diastolic hypertension |
|
No |
898 (70.1) |
1179 (83.1) |
540 (91.4) |
725 (95.1) |
|
Yes |
383 (29.9) |
240 (16.9) |
51 (8.6) |
37 (4.9) |
|
Combined hypertension |
|
No |
669 (65.5) |
959 (77.0) |
479 (87.4) |
643 (87.5) |
|
Yes |
352 (34.5) |
286 (23.0) |
69 (12.6) |
92 (12.5) |
|
WC* |
|
Normal |
958 (80.50) |
567 (42.82) |
482 (84.56) |
339 (48.4) |
|
High |
232 (19.5) |
757 (57.2) |
88 (15.4) |
362 (51.6) |
|
BMI, kg/m2 |
|
|
|
|
|
< 25 |
594 (46.9) |
595 (43.1) |
244 (41.3) |
225 (29.5) |
|
25–29.9 |
413 (32.60) |
405 (29.33) |
223 (37.7) |
220 (28.8) |
|
≥ 30 |
260 (20.5) |
381 (27.6) |
124 (21.0) |
319 (41.8) |
|
Tobacco use |
|
Ex-user/non-user |
1088 (84.3) |
1428 (99.9) |
435(73.6) |
748(97.9) |
|
Current user |
202 (15.7) |
2 (0.1) |
156 (26.4) |
16 (2.1) |
|
Fruits and vegetables, daily serving consumption |
|
Sufficient ≥ 5 |
286 (24.5) |
296 (22.7) |
64 (10.8) |
56 (7.3) |
|
Insufficient < 5 |
880 (75.5) |
1,007 (77.3) |
527 (89.2) |
708 (92.7) |
|
Physical activity |
|
Sufficient |
782 (60.6) |
754 (52.7) |
541 (91.5) |
723 (94.6) |
|
Insufficient |
137 (10.6) |
174 (12.2) |
25 (4.2) |
35 (4.6) |
*WC: waist circumference, normal for males WC <102 and female WC < 88, otherwise considered as high; BMI: body mass index; PA: physical activity.
The diabetes risk score was generated using multivariable logistic regression as shown in Table 2. It encompasses sex, age, educational attainment, material status, residence, hypertension status, BMI, and tobacco use. WC, daily consumption of fruit and vegetables, and insufficient physical activity were excluded from the final model in a stepwise fashion as they did not attain the level of statistical significance. The total diabetes risk score was calculated as the sum of the individual scores, ranging from 0 to 31 points.
Table 2: Diabetes risk score predictors by multivariable logistic regression using backward stepwise elimination method, Oman World Health Survey, 2008.
|
Intercept |
-4.7698 |
|
|
|
|
Sex |
|
|
|
|
|
Female |
- |
Reference |
|
0 |
|
Male |
0.4089 |
1.5 (1.1–2.1) |
0.017 |
2 |
|
Age group |
|
|
|
|
|
≤ 40 years |
- |
Reference |
|
0 |
|
≥ 40 years |
1.3967 |
4.0 (2.6–6.1) |
< 0.001 |
7 |
|
Education |
|
|
|
|
|
Yes |
- |
Reference |
|
0 |
|
No |
0.4453 |
1.6 (1.1–2.2) |
0.017 |
2 |
|
Marital status |
|
|
|
|
|
Single |
- |
Reference |
|
0 |
|
Married |
0.5220 |
1.7 (0.9–3.1) |
0.099 |
3 |
|
Divorced/separated |
0.7711 |
2.2 (0.9–3.1) |
0.080 |
4 |
|
Widowed |
0.9174 |
2.5 (1.2–5.3) |
0.018 |
5 |
|
Residence |
|
|
|
|
|
Rural |
- |
Reference |
|
0 |
|
Urban |
0.3682 |
1.4 (1.1–1.9) |
0.015 |
2 |
|
Combined hypertension |
|
|
|
|
|
No |
- |
Reference |
|
0 |
|
Yes |
0.7437 |
2.1 (1.5–2.9) |
< 0.001 |
4 |
|
*BMI, kg/m2 |
|
|
|
|
|
< 25 |
- |
Reference |
|
0 |
|
25–29.9 |
0.4089 |
1.5 (1.1–2.2) |
0.028 |
2 |
|
≥ 30 |
0.8364 |
2.3 (1.6–3.3) |
< 0.001 |
4 |
|
Tobacco use status |
|
|
|
|
|
Ex or non-user |
- |
Reference |
|
0 |
aOR: adjusted odds ratio; BM: body mass index; CI: confidence interval.
Overall, the prevalence of diabetes was increased in higher risk score categories by 42.2% and 45.1% in score categories 18–23 and ≥ 24, respectively [Table 3]. In addition, increasing score category was associated with an increased risk of diabetes. For higher score categories (12–17, 18–23, ≥ 24), the aORs (95% CIs) were 15.5 (7.5–32.1), 37.73 (18.3–77.8), and 73.5 (30.2–178.8), respectively [Table 3]. Similar results were obtained when the analysis was conducted for men and women separately.
Table 3: Overall diabetes prevalence and diabetes risk by score, World Health Survey 2008 (WHS 2008), and Sur health lifestyle survey 2006, Oman.
|
0–5 |
724 |
8 |
1.1 |
1 |
529 |
33 |
6.2 |
1 |
|
6–11 |
785 |
40 |
5.1 |
4.8 (2.2–10.3) |
379 |
35 |
9.2 |
1.5 (0.9–2.5) |
|
12–17 |
671 |
99 |
14.8 |
15.5 (7.5–32.1) |
327 |
71 |
21.7 |
4.1 (2.6–6.4) |
|
18–23 |
344 |
145 |
42.2 |
37.7 (18.3–77.8) |
119 |
50 |
42.0 |
10.8 (6.5–18.0) |
aOR: adjusted odds ratio; CI: confidence interval.
An increased risk of diabetes was noted in both men and women as the score elevated (data not shown).
The baseline demographic and the clinical characteristics of the participants in the Sur survey, distributed by gender, are illustrated in Table 1. More than half of the participants were female (56.4%; n = 764), and approximately 71.5% were in the 20–39 age group.
Despite some differences in the diabetes predictors between WHS 2008 and Sur Healthy Lifestyle Survey 2006, we have applied the developed score to assess how well it predicts the risk of diabetes in a different dataset. The overall prevalence of diabetes was elevated with increasing risk score to 21.7% and 42.0% in score categories 12–17 and 18–23, respectively. Additionally, a greater risk of diabetes was associated with an increase in score category. The adjusted odds of having diabetes were 10.9 times greater in the 18–23 category than the 0–5 category [Table 3]. Men had a higher risk of diabetes in the 18–23 score category than women: aOR 23.5 vs. 10.9. However, as the score category increases, the risk of diabetes becomes greater (data not shown).
The ROC curve and measuring AUC were used to assess the internal validation of the proposed score. Our score produced an AUC value of 0.80 (95% CI: 0.78–0.82) [Table 4]. The cutoff point for the diabetes risk score was calculated based on the probability cutoff value and was ≥ 15, producing a sensitivity of 71.1% and a specificity of 74.4%. Applying the derivate model equation to the validated sample dataset, the AUC was 0.74, 95% CI: 0.70–0.78 [Table 4]. A cutoff point for diabetes risk score of ≥ 13 produces a sensitivity of 54.0% and a specificity of 79.0% in the same cohort [Figure 1 and Table 5].
Table 4: Comparison of performance of the currently developed model with four pre-existing diabetes risk score models to predict prevalent type 2 diabetes in two Omani adult cohorts (World Health Survey 2008 (WHS 2008) and Sur Health lifestyle Project 2006).
|
Omani (Current) |
≥ 15 |
71.1% |
74.4%. |
0.80 (0.78–0.82) |
54.0% |
79.0% |
0.74 (0.70–0.78) |
|
Omani Old9 |
> 10 |
63.5% |
76.9% |
0.79 (0.76–0.82) |
48.1% |
81.8% |
0.75 (0.71–0.79) |
|
Finnish16 |
≥ 9 |
37.7% |
89.4% |
0.79 (0.75–0.83) |
43.6% |
84.0% |
0.70 (0.64–0.75) |
|
Kuwaiti17 |
> 32 |
34.6% |
87.1% |
0.77 (0.74–0.80) |
29.1% |
88.8% |
0.75 (0.71–0.79) |
CI: confidence interval; AUC: area under the curve.
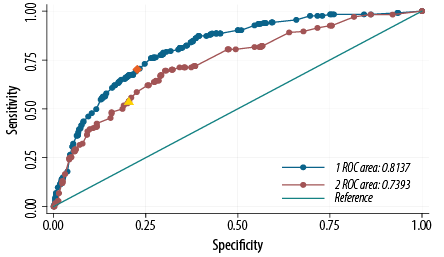
Figure 1: Receiver operation characteristic (ROC) curve showing the performance of the diabetes risk score model in predicting diabetes in the 2008 Oman World Health Survey (WHS 2008) (blue) and the Sur Healthy lifestyle survey 2006 (Sur 2006) (maroon) cohorts. The area under the WHS 2008 curve was 0.80, and the area under the Sur 2006 curve was 0.74. An optimal cutoff point for diabetes risk score of ≥ 15 (orange point) produced a sensitivity of 71.1% and a specificity of 74.4% in the WHS 2008 cohort, and a cutoff point for diabetes risk score of ≥ 13 (yellow point) produced a sensitivity of 54.0% and a specificity of 79.0% in the Sur 2006 cohort.
Table 5: Type 2 diabetes risk assessment table (Omanis).
|
What is your gender? |
|
|
Female |
0 |
|
Male |
2 |
|
What age are you now? |
|
|
≤ 40 years |
0 |
|
≥ 40 years |
7 |
|
Did you ever go to a government school? |
|
|
Yes |
0 |
|
No |
2 |
|
What is your current marital status? |
|
|
Single |
0 |
|
Married |
3 |
|
Divorced/separated |
4 |
|
Widowed |
5 |
|
Place of residence |
|
|
Rural |
0 |
|
Urban |
2 |
|
Combined hypertension |
|
|
No |
0 |
|
Yes |
4 |
|
What is your body mass index, kg/m2? |
|
|
<25 |
0 |
|
25-29.9 |
2 |
|
Are you: |
|
|
Ex or non-user of tobacco |
0 |
|
Current user of tobacco |
5 |
On testing the performance of the first Omani model,9 Finnish Concise model,16 Kuwaiti,17 and Saudi18 risk scores on Oman’s two cohorts (WHS 2008 and Sur 2006), the Finnish, the Kuwaiti, and the Saudi models showed similar performance on both Omani cohorts with low sensitivity and high specificity [Table 4].
Discussion
Our study provides an updated and simple risk assessment screening tool for T2DM based on causal risk factors that could be self-administered in community-based settings in developing countries. In our model, all regression coefficients were multiplied by a factor of five to allocate each variable category a risk score. The resulted risk score ranged from a minimum of zero to a maximum of 31 when scores were summed for all individual risk factors. In addition to using similar demographic variables as in previous reports in the populations of Oman, Finland, and the UK, respectively,9,16,19 our instrument introduced new variables consisting of eight modifiable and non-modifiable risk factors, whereas Kuwait’s risk score; for example, had only four variables.17
Although prevention programs can only address modifiable risk factors, the non-modifiable risk factors, such as age and gender, are significant components in determining an individual’s risk and are widely used in risk prediction models for diabetes mellitus.20 According to the American Diabetes Association, people should be screened by the age of 45, even without co-existing risk factors.21 We found that age was the most significant predictor for diabetes, and those who were ≥ 40 years of age had a four times higher risk than those < 40. We also found gender was associated significantly with the risk of diabetes, in contrast to the Omani score, in which gender was not a significant predictor.9
Similar to previous studies, high blood pressure, a modifiable risk factor, was a significant predictor of diabetes in our tool. Conen et al,22 showed that high blood pressure is a strong predictor for diabetes incidence in healthy middle-aged persons. Diabetes and hypertension often occur together in a subject and are correlated with obesity as a part of metabolic syndrome.23 We found that the risk of diabetes is increased two-fold among hypertensive patients. Similar results were reported by Al-Lawati et al,9 and by Lindström et al,16 who found in a Finnish score that the risk of diabetes was doubled in patients with hypertension.
Contrary to the Omani score, in which both WC and BMI have been independently associated with diabetes,9 our study showed only BMI but not WC as a significant predictor for diabetes. Similarly, the Cambridge diabetes risk score included only BMI as a significant predictor.19
Unlike the previous Omani score, in which no information was available for dietary intake or physical inactivity, we could incorporate physical inactivity and dietary intake into our model.9 However, these variables did not attain the significance level and were excluded from the final model. In the Finnish diabetes risk score, both factors were also shown not to be significant predictors but were kept in the model mainly to increase awareness of the modifiable risk factors.16 Our diabetes risk score is the first study including marital status to estimate the risk of diabetes in the Middle East. Marital status has been previously associated with diabetes.24 Our finding that widowed individuals had a 2.5 times higher risk than unmarried individuals was consistent with Cornelis et al,25 study in the US.
In addition, our study was among only a few taking into account education level in the diabetes risk assessment.20,26 We illustrated that the risk of diabetes was doubled in illiterate people compared to educated people. Similar findings were reported by Bayındır Çevik et al,27 in a population-based study conducted in Turkey.
Several studies have shown that tobacco use increases the risk of developing diabetes,20,28 and it has been included in previously reported risk scores, such as Australian and Saudi risk scores.18,29 Similarly, we found tobacco users had a 2.6 times higher risk than non-users. Prior diabetes risk scores in Oman and Kuwait did not include tobacco use.9,17
We also report an increased prevalence of diabetes in urban compared to rural areas (13.5% vs. 9.4%, p < 0.001). A systematic review of the prevalence of diabetes in Gulf countries demonstrated that the prevalence of diabetes was higher in urban areas.30 Unfortunately, we were unable to include data on the residential area during the model validation, as no information was provided in the Sur survey on the residence area of participants.
Overall, in comparison with the existing scores, based on demographic and anthropometric measurements and medical history, our score showed consistent associations with most of these variables.31 We consider our risk score to be more comprehensive by including eight modifiable and non-modifiable risk factors, some of which, such as marital status, had not previously been included previous diabetes risk scores. The performance of risk-prediction scores is commonly judged based on their sensitivity, specificity, and AUC.32 The performance of existing risk scores has shown mixed results in identifying high-risk individuals. For example, the Finnish diabetes score had a high sensitivity (81%) and specificity (76%).16 The Kuwaiti and Saudi diabetes risk scores had higher sensitivity (87% and 76.5%, respectively) and lower specificity (64% and 52.1%, respectively).17,18 The first Omani score was reported to have a sensitivity of 78.6% and a specificity of 73.4%.9 Our score was in between the above-mentioned models, with a sensitivity of 71.1% and a specificity of 74.4%.
Our risk score produced a high AUC (0.80) when applied to the WHS 2008. Comparable results have been reported from the Finnish diabetes risk score (AUC 0.85).16 The AUC of the Saudi risk score was 0.69.18 Therefore, our model performed well in its discrimination ability.
Overall, we have tested our score performance in the WHS 2008 sample and showed that it was internally valid based on its sensitivity, specificity, and AUC curves. Most risk score studies reported discrimination (AUC) as a measure of performance, while only a few studies reported both the discrimination and calibration parameters.6
Nonetheless, our model displayed lower external validity when it was applied to the Sur Survey 2006, as demonstrated by a decline in AUC value (0.74), low sensitivity (54.0%), and reasonable specificity (79.0%). Lower external validity can be, totally or partially, explained by the differences in the characteristics of the population.33 An example is the Finnish diabetes risk score, which was validated in the Philippine population where the discrimination power was lower (ROC = 0.74).5 We found statistically significant differences in the demographic and clinical characteristics between the two surveys of Oman regarding almost all of the variables. In addition, we did not apply our fully predicted model because the Sur survey was lacking information on residential areas, which might partially explain the lower score performance.
Furthermore, the suitability of the risk score in a population is determined by the prevalence of the diabetes risk factor in that population and the degree of association between the risk factors and diabetes.19,34 We found in the Sur survey 2006 that the association between diabetes and tobacco use was not significant, while it was significant in the WHS 2008. Although tobacco use was not a significant predictor, we still applied the proposed model to the Sur survey. This could also explain the lower score performance.
The main strength of our study is that the diabetes risk score was developed from a population-based study, which reduced selection bias. To our knowledge, this is the second diabetes risk score for the Omani population that was developed based on simple demographic, anthropometric, and clinical characteristics.9 Our comprehensive score included traditional modifiable risk factors and introduced new variables, such as education, marital status, and residence area.
The aim was to increase awareness of modifiable risk factors and the importance of having a healthy lifestyle when the risk score is implemented practically in community screening of diabetes.
However, some limitations of this study need to be considered. First, a family history of diabetes is an important risk factor, and it was not included in the risk score because no information was available in the used dataset. This factor reveals the genetic predisposition toward developing diabetes. However, lifestyle modification can reduce diabetes incidence even in genetically susceptible individuals.16 Second, we were not able to apply our predicted model fully, as the Sur survey 2006 did not collect information on residential areas. Third, we excluded a large number of observations (736 subjects, 20.9%) because the outcome of diabetes was unknown. A disproportionate number (63.0%) of that unknown diabetes status was from subjects < 40 years of age, as these individuals are at a lower risk of diabetes. This might have introduced a differential bias, as the health status of the responders may differ from the potential health of those who did not participate, and thus results would be biased toward a healthier population. Fourth, our risk score was based on the analysis of secondary data from a cross-sectional WHS 2008, and the information from the original survey was collected on self-reported chronic diseases, which might have introduced a potential for volunteer bias, possibly toward a healthier population. Fifth, the lack of longitudinal data in this study is a limitation. The cross-sectional data provide only the association of prevalent cases of T2DM with the risk score rather than identifying incidence cases. Therefore, it cannot be used to estimate the risk of future disease.35 However, many studies have shown good validation among similar risk scores, even in a cross-sectional setting. Although the Cambridge diabetes risk score was developed from a cross-sectional survey, it performed moderately well in predicting diabetes risk in a prospective cohort with a follow-up of 4.8 years.19
Conclusion
We developed a comprehensive predicted diabetes risk score based on demographic and anthropometric measurements readily available in primary health care. It is a unique score as it includes eight modifiable and non-modifiable risk factors with good sensitivity and specificity. To date, this is the second non-invasive, simple and safe instrument developed for the Omani population, as diabetes is a major health concern in Oman, and there has been a steady rise in its prevalence over the last two decades.
Disclosure
The authors declared no conflicts of interest. No funding was received for this study.
Acknowledgements
We would like to thank the Directorate of Planning in the Ministry of Health, Oman for providing the survey data.
references
- 1. Mirahmadizadeh A, Fathalipour M, Mokhtari AM, Zeighami S, Hassanipour S, Heiran A. The prevalence of undiagnosed type 2 diabetes and prediabetes in Eastern Mediterranean region (EMRO): a systematic review and meta-analysis. Diabetes Res Clin Pract 2020 Feb;160:107931.
- 2. Cho NH, Shaw JE, Karuranga S, Huang Y, da Rocha Fernandes JD, Ohlrogge AW, et al. IDF Diabetes Atlas: global estimates of diabetes prevalence for 2017 and projections for 2045. Diabetes Res Clin Pract 2018 Apr;138:271-281.
- 3. Al-Riyami A, Abdelaty MA, Jaju S, Morsi M, Al-Kharusi H, Al-Shekaili W. World Health Survey 2008. Available from Department of Research, Directorate General of Planning, Ministry of Health, Oman 2012.
- 4. Beagley J, Guariguata L, Weil C, Motala AA. Global estimates of undiagnosed diabetes in adults. Diabetes Res Clin Pract 2014 Feb;103(2):150-160.
- 5. Ku GM, Kegels G. The performance of the Finnish diabetes risk score, a modified Finnish diabetes risk score and a simplified Finnish diabetes risk score in community-based cross-sectional screening of undiagnosed type 2 diabetes in the Philippines. Prim Care Diabetes 2013 Dec;7(4):249-259.
- 6. Buijsse B, Simmons RK, Griffin SJ, Schulze MB. Risk assessment tools for identifying individuals at risk of developing type 2 diabetes. Epidemiol Rev 2011;33(1):46-62.
- 7. Phillips CM, Kearney PM, McCarthy VJ, Harrington JM, Fitzgerald AP, Perry IJ. Comparison of diabetes risk score estimates and cardiometabolic risk profiles in a middle-aged Irish population. PLoS One 2013 Nov;8(11):e78950.
- 8. Brown N, Critchley J, Bogowicz P, Mayige M, Unwin N. Risk scores based on self-reported or available clinical data to detect undiagnosed type 2 diabetes: a systematic review. Diabetes Res Clin Pract 2012 Dec;98(3):369-385.
- 9. Al-Lawati JA, Tuomilehto J. Diabetes risk score in Oman: a tool to identify prevalent type 2 diabetes among Arabs of the Middle East. Diabetes Res Clin Pract 2007 Sep;77(3):438-444.
- 10. Al-Lawati JA, Panduranga P, Al-Shaikh HA, Morsi M, Mohsin N, Khandekar RB, et al. Epidemiology of diabetes mellitus in Oman: results from two decades of research. Sultan Qaboos Univ Med J 2015 May;15(2):e226-e233.
- 11. Al Riyami A, Elaty MA, Morsi M, Al Kharusi H, Al Shukaily W, Jaju S. Oman world health survey: part 1 - methodology, sociodemographic profile and epidemiology of non-communicable diseases in Oman. Oman Med J 2012 Sep;27(5):425-443.
- 12. Al-Farsi M, El-Melighy M, Mohammed S, Ali L. Healthy lifestyle study: assessment of lifestyle risk factors among Sur city population. Oman: Ministry of Health; 2006.
- 13. World Health Organization. Definition, diagnosis and classification of diabetes mellitus and its complications. Part 1: diagnosis and classification of diabetes mellitus provisional report of a WHO consultation. Geneva: World Health Organization; 1999.
- 14. National Centre for Statistics and Information. Selected data and indicators from the results of general populations, housing and establishments census, 1993, 2003, 2010. In: General Census of Population, Housing & Establishments, editors. Muscat: National Centre for Statistics and Information; 2010.
- 15. Hanley JA, McNeil BJ. The meaning and use of the area under a receiver operating characteristic (ROC) curve. Radiology 1982 Apr;143(1):29-36.
- 16. Lindström J, Tuomilehto J. The diabetes risk score: a practical tool to predict type 2 diabetes risk. Diabetes Care 2003 Mar;26(3):725-731.
- 17. Al Khalaf MM, Eid MM, Najjar HA, Alhajry KM, Doi SA, Thalib L. Screening for diabetes in Kuwait and evaluation of risk scores. East Mediterr Health J 2010 Jul;16(7):725-731.
- 18. Memish ZA, Chang JL, Saeedi MY, Al Hamid MA, Abid O, Ali MK. Screening for type 2 diabetes and dysglycemia in Saudi Arabia: development and validation of risk scores. Diabetes Technol Ther 2015 Oct;17(10):693-700.
- 19. Rahman M, Simmons RK, Harding A-H, Wareham NJ, Griffin SJ. A simple risk score identifies individuals at high risk of developing type 2 diabetes: a prospective cohort study. Fam Pract 2008 Jun;25(3):191-196.
- 20. Sun F, Tao Q, Zhan S. An accurate risk score for estimation 5-year risk of type 2 diabetes based on a health screening population in Taiwan. Diabetes Res Clin Pract 2009 Aug;85(2):228-234.
- 21. American Diabetes Association. Standards of medical care in diabetes–2013. Diabetes Care 2013 Jan;36(Suppl 1):S11-S66.
- 22. Conen D, Ridker PM, Mora S, Buring JE, Glynn RJ. Blood pressure and risk of developing type 2 diabetes mellitus: the women’s health study. Eur Heart J 2007 Dec;28(23):2937-2943.
- 23. Bozorgmanesh M, Hadaegh F, Ghaffari S, Harati H, Azizi F. A simple risk score effectively predicted type 2 diabetes in Iranian adult population: population-based cohort study. The European Journal of Public Health 2011;21(5):554-559.
- 24. Choi BC, Shi F. Risk factors for diabetes mellitus by age and sex: results of the national population health survey. Diabetologia 2001 Oct;44(10):1221-1231.
- 25. Cornelis MC, Chiuve SE, Glymour MM, Chang S-C, Tchetgen Tchetgen EJ, Liang L, et al. Bachelors, divorcees, and widowers: does marriage protect men from type 2 diabetes? PLoS One 2014 Sep;9(9):e106720.
- 26. Alghadir A, Awad H, Al-Eisa E, Alghwiri A. Diabetes risk 10 years forecast in the capital of Saudi Arabia: Canadian diabetes risk assessment questionnaire (CANRISK) perspective. Biomed Res 2014;25(1):88-96.
- 27. Bayındır Çevik A, Metin Karaaslan M, Koçan S, Pekmezci H, Baydur Şahin S, Kırbaş A, et al. Prevalence and screening for risk factors of type 2 diabetes in Rize, Nourtheast Turkey: findings from a population-based study. Prim Care Diabetes 2016 Feb;10(1):10-18.
- 28. Spijkerman AM, van der A DL, Nilsson PM, Ardanaz E, Gavrila D, Agudo A, et al; InterAct Consortium. Smoking and long-term risk of type 2 diabetes: the EPIC-InterAct study in European populations. Diabetes Care 2014 Dec;37(12):3164-3171.
- 29. Chen L, Magliano DJ, Balkau B, Colagiuri S, Zimmet PZ, Tonkin AM, et al. AUSDRISK: an Australian type 2 diabetes risk assessment tool based on demographic, lifestyle and simple anthropometric measures. Med J Aust 2010 Feb;192(4):197-202.
- 30. Alhyas L, McKay A, Majeed A. Prevalence of type 2 diabetes in the States of the co-operation council for the Arab States of the Gulf: a systematic review. PLoS One 2012;7(8):e40948.
- 31. Ayensa-Vazquez JA, Leiva A, Tauler P, López-González AA, Aguiló A, Tomás-Salvá M, et al. Agreement between type 2 diabetes risk scales in a Caucasian population: a systematic review and report. J Clin Med 2020 May;9(5):9.
- 32. Bhowmik B, Akhter A, Ali L, Ahmed T, Pathan F, Mahtab H, et al. Simple risk score to detect rural Asian Indian (Bangladeshi) adults at high risk for type 2 diabetes. J Diabetes Investig 2015 Nov;6(6):670-677.
- 33. Liu M, Pan C, Jin M. A Chinese diabetes risk score for screening of undiagnosed diabetes and abnormal glucose tolerance. Diabetes Technol Ther 2011 May;13(5):501-507.
- 34. Zhang M, Zhang H, Wang C, Ren Y, Wang B, Zhang L, et al. Development and validation of a risk-score model for type 2 diabetes: a cohort study of a rural adult Chinese population. PLoS One 2016 Apr;11(4):e0152054.
- 35. Gray LJ, Davies MJ, Hiles S, Taub NA, Webb DR, Srinivasan BT, et al. Detection of impaired glucose regulation and/or type 2 diabetes mellitus, using primary care electronic data, in a multiethnic UK community setting. Diabetologia 2012 Apr;55(4):959-966.