Glioma tumors are the most common tumors of the central nervous system causing 40–50% of brain tumors and 2–3% of all cancers globally.1 Despite modern techniques developed for brain tumor treatments, high-grade gliomas are still considered hard responding to treatments.2 Early diagnosis of malignant glioma helps successful treatment;3 therefore, developing methods to detect malignant tumors is essential. It has been demonstrated that Magnetic resonance imaging (MRI) is a valuable diagnostic tool in oncology due to the high spatial resolution and contrast of soft tissues.4–6 Although common MRI sequences have many advantages in the diagnosis and evaluation of brain tumors, these sequences are not effective tools for differentiation of the tumor types or grades.4
Diffusion-weighted imaging (DWI) relies on the diffusion of water molecules to create contrast between normal and abnormal tissues; it has a proven ability to differentiate between benign and malignant tumors in various sites.4,7,8 Apparent diffusion coefficient (ADC) values are obtained from a series of DWIs with different gradients.9 Previous studies had shown that ADC measurement could distinguish several certain types of brain and cerebral tumors, including malignant and benign meningiomas, high-grade and low-grade gliomas, brain metastasis, and vestibular schwannomas.10–12
The use of ADC values to differentiate low- and high-grade gliomas have been assessed in previous studies.4,7,8,13 However, the ADC values in different areas like the tumor center, edema, boundaries between normal tissue and edema have rarely been investigated for differentiating high- and low-grade gliomas. Therefore, our study aimed to measure the ADC values at various brain regions of the patients with glioma tumors to quantify the differences between high- and low-grade gliomas.
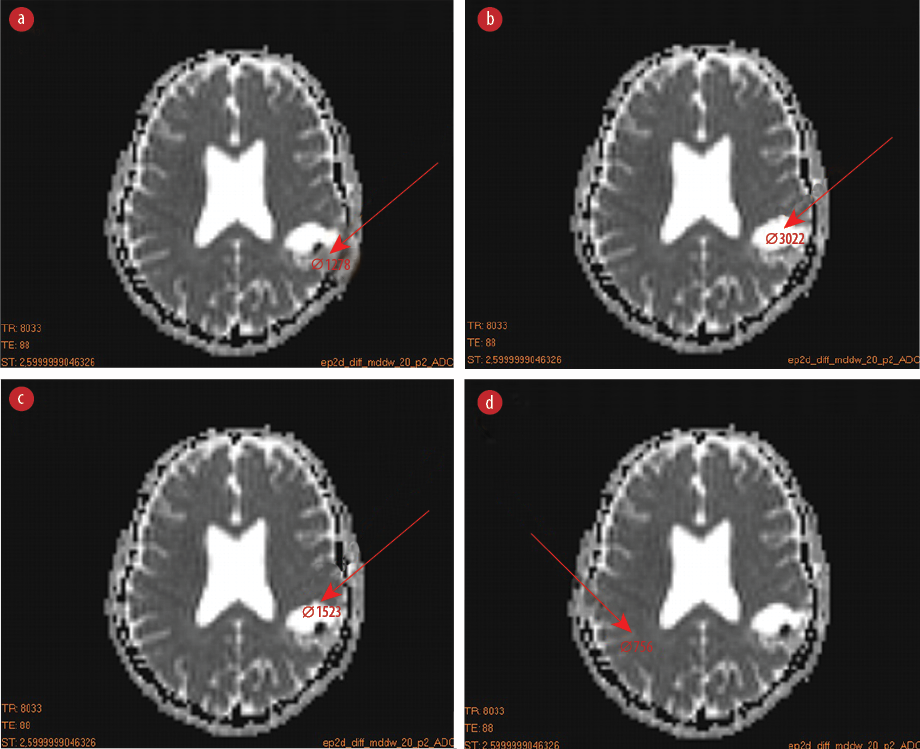
Figure 1: Region of interests (ROIs) placement for measuring the apparent diffusion coefficient values in various sites of the brain. (a) ROI at the center of the tumor, (b) the tumor edema but not at the center, (c) the boundary of tumor edema with surrounding normal tissue, and (d) ROI at the normal tissues located in the healthy hemisphere.
Methods
We conducted a multicenter, retrospective study conducted from September to December 2019 following national research ethics board approval. The calculated ADC map and pathological results of 56 patients with brain tumors were recorded for analysis. The patients had an average age of 45.0±7.0 years, including 34 men (16 with malignant glioblastoma multiform and astrocytoma grade III tumors, and 18 with astrocytoma grade I and II tumors), and 22 women (12 with malignant glioblastoma multiform and astrocytoma grade III tumors, and 10 with astrocytoma grade I and II tumors). The patients were divided into two groups with equal size including low-grade (I and II) and high-grade (III and IV) gliomas based on the pathological results. The MRI images were acquired using a 1.5-Tesla Siemens Emotion scanner (Siemens Healthcare GmbH, Erlangen, Germany) applying diffusion gradients in three independent directions. All of the images were taken by three gradient b-values of 0, 500, and 1000 mm2/s. Dicom Works software (DicomWorks v1.3.5 2000, 2002; License: Freeware Free; Publishers: Phillippe Puech and Loic Boussel) were used to obtain the ADC values in different regions of MRI DWIs. Four region of interests (ROIs) were drawn on the ADC map for each patient’s image including: 1) ROI at the center of the tumor [Figure 1a]; 2) the tumor edema but not at the center [Figure 1b]; 3) the boundary of edema with surrounding normal tissue [Figure 1c]; and 4) ROI at the normal tissues located in the healthy hemisphere [Figure 1d].
The receiver operating characteristic (ROC) curve was used to evaluate the diagnostic ability of the ADC value to differentiate between high- and low-grade glioma tumors. The cut-off value was chosen to maximize the Youden index.14 Furthermore, sensitivity and specificity values were calculated using the ROC curves.
SPSS statistical software (IBM Corp. Released 2010. IBM SPSS Statistics for Windows, Version 19.0. Armonk, NY: IBM Corp.) was employed to distinguish tumor types and obtain the ADC cut-off values. Furthermore, we used the Mann-Whitney statistical test to compare the ADC values of different regions between the high- and low-grade gliomas groups.
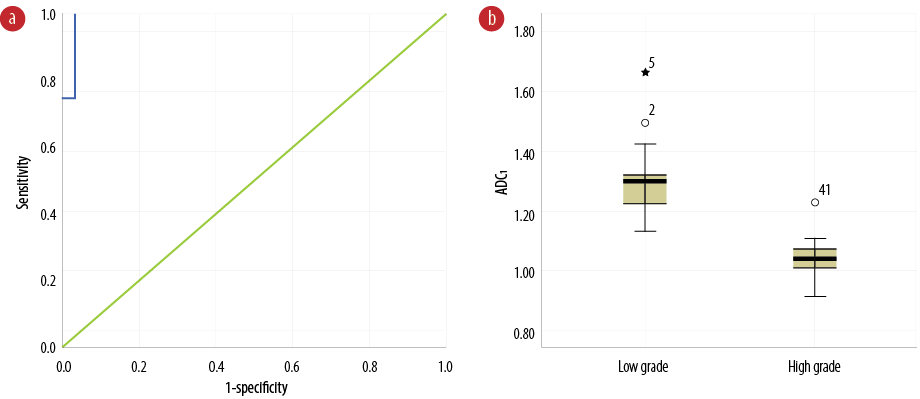
Figure 2: (a) Receiver operating characteristic curve of apparent diffusion coefficient (ADC) values contracted the tumor’s center (ADC1) to differentiate benign from malignant glioma tumors. (b) Comparison of ADC1 values between benign and malignant glioma tumors.
Table 1: Area under the receiver operating characteristic curve of ADC1, ADC2, ADC3, and ADC4 values.
|
ADC1 |
99.1 |
1.0 |
< 0.001 |
0.97–1.00 |
|
ADC2 |
72.3 |
7.0 |
0.004 |
0.58–0.86 |
|
ADC3 |
41.5 |
7.7 |
0.272 |
0.26–0.56 |
ADC: apparent diffusion coefficient.
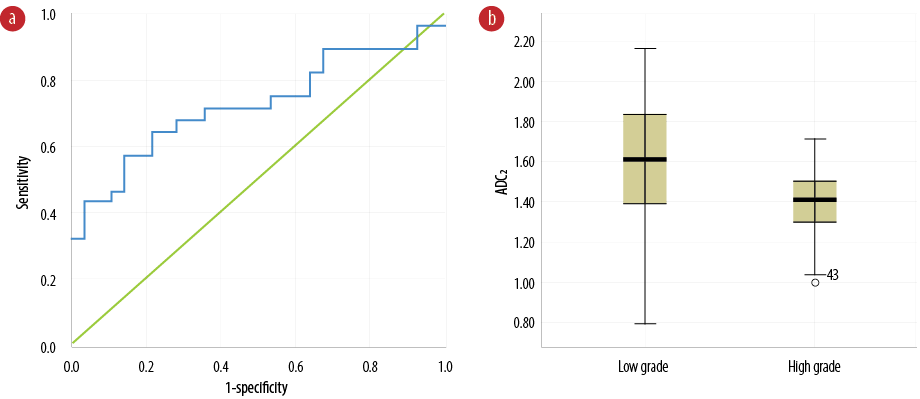
Figure 3: (a) Receiver operating characteristic curve of apparent diffusion coefficient (ADC) values contracted tumor edema (ADC2) to differentiate benign from malignant glioma tumors. (b) Comparison of ADC2 values between benign and malignant glioma tumors.
Table 2: Mean, median, confidence interval, and range of tumor edema of the apparent diffusion coefficient (ADC) of four regions with scale of 10-3 mm2/s.
|
Low grade (ADC1) |
1.2 |
1.29 |
1.26–1.33 |
1.13 |
1.67 |
|
High grade (ADC1) |
1.0 |
1.04 |
1.02–1.07 |
0.92 |
1.23 |
|
Low grade (ADC2) |
1.5 |
1.61 |
1.47–1.70 |
0.79 |
2.17 |
|
High grade (ADC2) |
1.4 |
1.41 |
1.34–1.47 |
0.98 |
1.72 |
|
Low grade (ADC3) |
0.7 |
0.84 |
0.73–0.85 |
0.08 |
0.98 |
|
High grade (ADC3) |
0.8 |
0.84 |
0.80–0.87 |
0.67 |
1.04 |
|
Low grade (ADC4) |
0.8 |
0.82 |
0.78–0.82 |
0.62 |
0.87 |
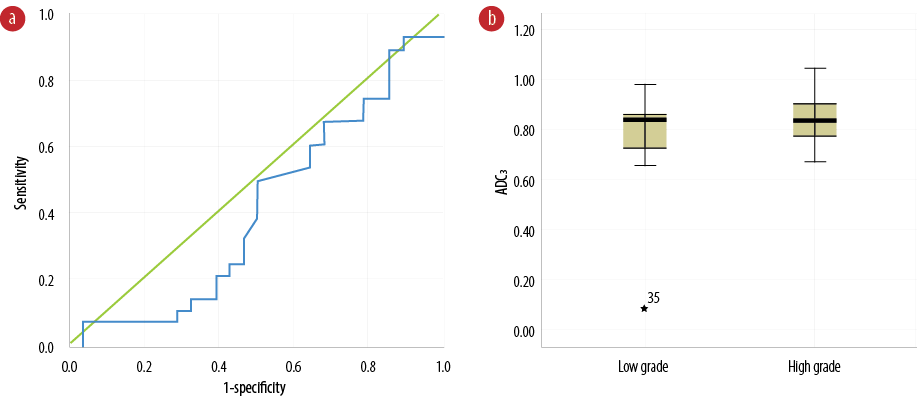
Figure 4: (a) Receiver operating characteristic curve of apparent diffusion coefficient (ADC) values between normal tissue and tumor border (ADC3) to differentiate benign from malignant glioma tumors. (b) Comparison of ADC3 values between benign and malignant glioma tumors.
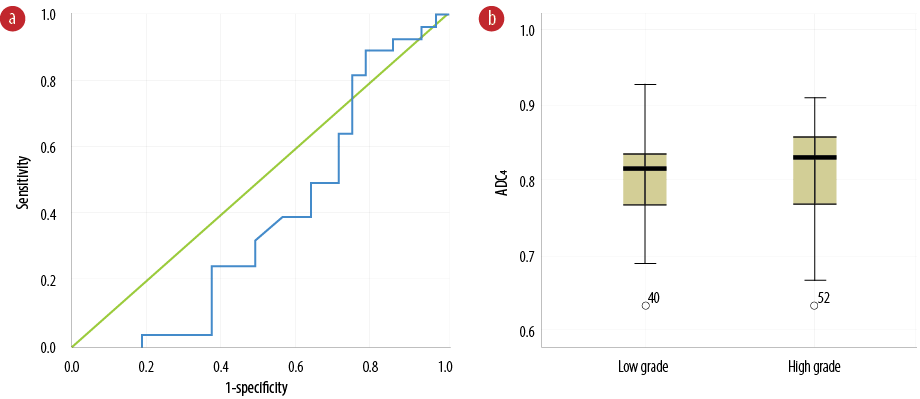
Figure 5: (a) Receiver operating characteristic curve of apparent diffusion coefficient (ADC) values of normal tissue located in the healthy hemisphere (ADC4) to differentiate benign from malignant glioma tumors. (b) Comparison of ADC4 values between benign and malignant glioma tumors.
Results
The clear area under the ROC curve related to low-grade glioma tumors was equal to 99.1%, as demonstrated in Figure 2a and Table 1. Diagnostic ADC threshold for tumor center (ADC1) was 1.12×10⁻³ mm2/s (sensitivity = 100% and specificity = 96.0%) with the diagnostic threshold phase error of 1.0%. Figure 2b shows ADC1 values for patients with high- and low-grade tumors. There is no overlap between the quartiles for each group. The ADC1 values of high-grade tumors are significantly lower compared to those in low-grade tumors (p < 0.001). The median, mean, and range for ADC1 are shown in Table 2.
The results of quantitative and ADC analysis of tumor edema areas (ADC2) revealed the area under the curve was equal to 72.3%, as demonstrated in Figure 3a and Table 1. The diagnostic threshold was 1.15×10⁻³ mm2/s (sensitivity = 75.0% and specificity = 64.0%) with the diagnostic threshold phase error of 7.0%. Figure 3b shows the ADC2 for patients with low- and high-grade tumors. The ADC2 values of high-grade tumors are significantly lower than low-grade tumors (p = 0.004). Table 2 shows the median, mean, and range of ADC2.
The diagnostic threshold for quantitative and ADC analysis in areas between the tumor and normal tissue (ADC3) values was 0.84×10⁻³ mm2/s (sensitivity = 50.0% and specificity = 50.0%). Figure 4a indicates the curved-boundary between tumor and normal tissue ADC values. The area under the curve was equal to 41.5%, with a 7.7% error. Figure 4b represents the range of ADC values on the border between the tumor edema and surrounding normal tissue in both low- and high-grade groups. Diagnosis of low- and high-grade tumors, based on the ADC3 values, seems to be difficult due to no significant differences in ADC3 values between the groups (Figure 4b). The ADC3 values in high-grade tumors did not show any significantly higher values than those in low-grade tumors (p = 0.272). The median, mean, and range of the ADC3 are shown in Table 2.
Results of quantitative and ADC analysis of normal tissue located in the healthy hemisphere (ADC4) revealed an area under the curve and error in the implementation phase of 38.9% and 79.0%, respectively [Table 1]. Figure 5a shows the ROC curve of ADC values of normal tissue located in the healthy hemisphere (ADC4) to differentiate between low- and high-grade glioma tumors. Figure 5b indicates the comparison of ADC4 values between both glioma tumors. There were not any significant differences in the ADC4 values between the groups (p = 0.157). Table 2 shows the median, mean and range of ADC4. The diagnostic ADC threshold value in normal tissues located in the healthy hemisphere (ADC4) for differentiating low and high grade gliomas was 0.76 × 10⁻³ mm2/s (sensitivity = 89.3% and specificity = 22.2%). Regarding the quantitative analysis, it is worth to mention that there was no significant differences between the low and high grade gliomas in healthy brain.
Discussion
We evaluated the ability of DWI and ADC values obtained from four various brain regions in differentiating between high- and low-grade brain glioma tumors. We found that ADC cut-off values were able to distinguish these tumors.
MRI has been used to evaluate patients with brain tumors.15–17 In DWI, the random movement of water molecules that are aligned with fiber tracts in the central nervous system was determined to find the susceptible tumor tissues. Different degrees of field gradients are applied for quantification of diffusion for calculating the ADC values in tissue.18–20
Our results showed significantly lower ADC values at tumor center and edemas (ADC1 and ADC2) in patients with high-grade tumors than those with low-grade tumors. Furthermore, the ADC values at the boundaries between tumor edema with normal tissue and healthy brain hemisphere (ADC3 and ADC4) indicated no significantly higher values in patients with low-grade glioma tumors. Lower values of ADC1 and ADC2 might be explained by the increased cellularity and higher tumor density in these areas in patients having high-grade glioma tumors, as well as malignant tumors clutter tissue and the increased curvature of the space between the cells, which slow down water molecules and reduce their ADC.4,7,8 Not significantly higher values of ADC3 and ADC4 in patients with high-grade glioma tumors can be due to microcystic degeneration, necrosis foci, and overproduction of extracellular matrix components of glioma cells at the boundary of tumoral tissue, edema, and in healthy tissues.7,21 A meta-analysis review study provided clinical evidence regarding the relationship between ADC and cellularity in different tumors.22 The correlation coefficient between ADC and cellularity in glioma was R = -0.66, which was the strongest correlation among various tumors. Therefore, the ADC values could be a useful tool for differentiating low- and high-grade glioma tumors.
The lower intratumoral ADC values have been linked to increased cellularity; therefore, the regions with minimum ADC reflect the highest tumoral density in this regard.8
Several studies investigated the DWI ability to distinguish the various types of brain tumors,23–25 whereas some other studies have shown that intratumoral ADC value is not useful to differentiate between some of the brain or cerebral tumors.26–28 For example, some studies have found higher intratumoral ADC values in brain metastasis compared to high-grade gliomas, but they have several limitations, such as a small number of patients.29,30
The cut-off values of ADC1 and ADC2 had higher sensitivity and specificity than those for ADC3 and ADC4. The ROIs of ADC1 and ADC2 were contoured inside the tumor regions, while the ROIs of other ADC values were defined outside the tumor. Therefore, it was expected that ADC1 and ADC2 values could have better differentiation between low- and high-grade tumors.
The ability of ADC measurement for detecting malignant and benign tumors has been investigated in previous researches.8,24,25 Woodhams et al,31 expressed that ADC values lower than 1.6×10⁻³ mm2/s were related to invasive ductal carcinoma. They also reported that the sensitivity of this method was 95%.
Sui et al,32 indicated that MRI DWI with high b-values can differentiate various low- and high-grade pediatric brain tumors (medulloblastomas, glioblastoma multiformes, germinomas, pineoblastomas, anaplastic epedymomas, anaplastic astrocytomas, etc.) with high accuracy. The fractional-order calculus model was used in this study to improve the accuracy of differentiating among low- and high-grade pediatric brain tumors.
We evaluated the ADC values obtained from four different brain regions; however, in previous studies4,6,7,12 the ADC values inside the tumor region were assessed to differentiate low- and high-grade tumors. The ADC cut-off values for differentiating low-grade glioma tumors from high-grade ones at the tumor center and edema were 1.12 × 10⁻³ mm2/s (sensitivity = 100% and specificity = 96.0%) and 1.15 × 10⁻³ mm2/s (sensitivity = 75.0% and specificity = 64.0%), respectively. In a study by Sasaki et al,33 the ADC values were evaluated for differentiating benign and malignant tumors in the head and neck. They did not assess the ADC differences between the malignant and benign glioma tumors. However, they showed that the mean ADC of malignant lymphomas (0.66×10⁻³ mm2/s) was significantly smaller than that of carcinomas. The mean ADC of carcinomas (1.13×10⁻³ mm2/s) was significantly smaller than that of benign solid tumors. The mean ADC of benign solid tumors (1.56×10⁻³ mm2/s) was significantly smaller than that of benign cystic lesions (2.05×10⁻³ mm2/s). The ADC values < 1.22×10⁻³ mm2/s were used for predicting malignancy, having an accuracy of 86%, with 84% sensitivity and 91% specificity.
In addition to the DWI and ADC measurement, which we used in our study, other MRI methods can be used to differentiate glioma tumors. For example, arterial spin labeling (ASL) is a perfusion imaging technique that uses arterial blood water as an intrinsic magnetic tracer. This technique can be applied to evaluate the cerebral blood flow in tumor tissue.34,35 Several studies reported the clinical ability of ASL to differentiate glioblastoma from metastasis depending on the peritumoral part.36,37 Another technique, diffusion tensor imaging (DTI) has been used to differentiate glioblastomas from brain metastases using diffusion tensor metrics, such as mean diffusivity and fraction anisotropy.36–38 As subjects for future research, other MRI techniques with the ability of tumor differentiation, like MR spectroscopy as a useful technique in the differential diagnosis of brain tumors,7 DTI, and ASL34,35,38–40 could be used along with the ADC results to find the appropriate MRI protocol for distinguishing the various brain tumors and grades.
The sample size of our study was relatively small, therefore, further studies are needed to confirm these results. Furthermore, it is possible to better differentiate tumor grades (I, II, III, and IV) having bigger sample sizes.
Conclusion
ADC measurement in tumor and edema can be very efficient in differentiating low- and high-grade glioma tumors. The ADC values of low-grade tumors were larger than high-grade ones because of higher cellularity of malignant tumors and inverse relationship between ADC and cellularity. By comparing the ROC curves of ADC values in various regions, it can be noted that the ADC values in the tumor center and edema had better sensitivity and specificity for reliable differentiating between low- and high-grade glioma tumors compared to ADC values of edema boundaries and surrounding healthy tissues. The ADC values at tumor center and tumor edema higher than 1.12×10⁻³ mm2/s and 1.15 × 10⁻³ mm2/s, respectively, could be classified as low-grade, and tumors with lower values could be classified as high-grade tumors.
Disclosure
The authors declared no conflict of interest.
Acknowledgements
This study was supported by the research council of Shiraz University of Medical Sciences (ethical committee consent number IR.SUMS.REC.1394.S472). We would like to thank the center of comparative and experimental medicine at Shiraz University of Medical Sciences, and MRI center of Faghihi Hospital (Shiraz, Iran).
references
- 1. da Cruz LC Jr, Gasparetto EL, Domingues RC, Domingues RC. Diffusion-weighted MR imaging in brain tumor. MAGNETOM Flash 2008;2:21-29.
- 2. Kwee TC, Galbán CJ, Tsien C, Junck L, Sundgren PC, Ivancevic MK, et al. Intravoxel water diffusion heterogeneity imaging of human high-grade gliomas. NMR Biomed 2010 Feb;23(2):179-187.
- 3. Reardon DA, Rich JN, Friedman HS, Bigner DD. Recent advances in the treatment of malignant astrocytoma. J Clin Oncol 2006 Mar;24(8):1253-1265.
- 4. Vermoolen MA, Kwee TC, Nievelstein RA. Apparent diffusion coefficient measurements in the differentiation between benign and malignant lesions: a systematic review. Insights Imaging 2012 Aug;3(4):395-409.
- 5. Bazot M, Daraï E, Nassar-Slaba J, Lafont C, Thomassin-Naggara I. Value of magnetic resonance imaging for the diagnosis of ovarian tumors: a review. J Comput Assist Tomogr 2008 Sep-Oct;32(5):712-723.
- 6. Moghadam FF. Using nanoparticles in medicine for liver cancer imaging. Oman Med J 2017 Jul;32(4):269-274.
- 7. Tsougos I, Svolos P, Kousi E, Fountas K, Theodorou K, Fezoulidis I, et al. Differentiation of glioblastoma multiforme from metastatic brain tumor using proton magnetic resonance spectroscopy, diffusion and perfusion metrics at 3 T. Cancer Imaging 2012 Oct;12(3):423-436.
- 8. Chen L, Liu M, Bao J, Xia Y, Zhang J, Zhang L, et al. The correlation between apparent diffusion coefficient and tumor cellularity in patients: a meta-analysis. PLoS One 2013 Nov;8(11):e79008.
- 9. Razek AA, Elmongy A, Hazem M, Zakareyia S, Gabr W. Idiopathic Parkinson disease effect of levodopa on apparent diffusion coefficient value of the brain. Acad Radiol 2011 Jan;18(1):70-73.
- 10. Svolos P, Tsolaki E, Kapsalaki E, Theodorou K, Fountas K, Fezoulidis I, et al. Investigating brain tumor differentiation with diffusion and perfusion metrics at 3T MRI using pattern recognition techniques. Magn Reson Imaging 2013 Nov;31(9):1567-1577.
- 11. Xu X-Q, Li Y, Hong X-N, Wu F-Y, Shi H-B. Radiological indeterminate vestibular schwannoma and meningioma in cerebellopontine angle area: differentiating using whole-tumor histogram analysis of apparent diffusion coefficient. Int J Neurosci 2017 Feb;127(2):183-190.
- 12. Surov A, Ginat DT, Sanverdi E, Lim CC, Hakyemez B, Yogi A, et al. Use of diffusion weighted imaging in differentiating between maligant and benign meningiomas. A multicenter analysis. World Neurosurg 2016 Apr;88:598-602.
- 13. Park MJ, Cha ES, Kang BJ, Ihn YK, Baik JH. The role of diffusion-weighted imaging and the apparent diffusion coefficient (ADC) values for breast tumors. Korean J Radiol 2007 Sep-Oct;8(5):390-396.
- 14. Nakas CT, Alonzo TA, Yiannoutsos CT. Accuracy and cut-off point selection in three-class classification problems using a generalization of the Youden index. Stat Med 2010 Dec;29(28):2946-2955.
- 15. Seppi K, Poewe W. Brain magnetic resonance imaging techniques in the diagnosis of parkinsonian syndromes. Neuroimaging Clin N Am 2010 Feb;20(1):29-55.
- 16. Sitburana O, Ondo WG. Brain magnetic resonance imaging (MRI) in parkinsonian disorders. Parkinsonism Relat Disord 2009 Mar;15(3):165-174.
- 17. Brooks DJ. Assessment of Parkinson’s disease with imaging. Parkinsonism Relat Disord 2007;13(Suppl 3):S268-S275.
- 18. Menke RA, Scholz J, Miller KL, Deoni S, Jbabdi S, Matthews PM, et al. MRI characteristics of the substantia nigra in Parkinson’s disease: a combined quantitative T1 and DTI study. Neuroimage 2009 Aug;47(2):435-441.
- 19. Tessa C, Giannelli M, Della Nave R, Lucetti C, Berti C, Ginestroni A, et al. A whole-brain analysis in de novo Parkinson disease. AJNR Am J Neuroradiol 2008 Apr;29(4):674-680.
- 20. Karagulle Kendi AT, Lehericy S, Luciana M, Ugurbil K, Tuite P. Altered diffusion in the frontal lobe in Parkinson disease. AJNR Am J Neuroradiol 2008 Mar;29(3):501-505.
- 21. Pope WB, Mirsadraei L, Lai A, Eskin A, Qiao J, Kim HJ, et al. Differential gene expression in glioblastoma defined by ADC histogram analysis: relationship to extracellular matrix molecules and survival. AJNR Am J Neuroradiol 2012 Jun;33(6):1059-1064.
- 22. Surov A, Meyer HJ, Wienke A. Correlation between apparent diffusion coefficient (ADC) and cellularity is different in several tumors: a meta-analysis. Oncotarget 2017 May;8(35):59492-59499.
- 23. Eidel O, Neumann J-O, Burth S, Kieslich PJ, Jungk C, Sahm F, et al. Automatic analysis of cellularity in glioblastoma and correlation with ADC using trajectory analysis and automatic nuclei counting. PLoS One 2016 Jul;11(7):e0160250.
- 24. Caravan I, Ciortea CA, Contis A, Lebovici A. Diagnostic value of apparent diffusion coefficient in differentiating between high-grade gliomas and brain metastases. Acta Radiol 2018 May;59(5):599-605.
- 25. Surov A, Gottschling S, Mawrin C, Prell J, Spielmann RP, Wienke A, et al. Diffusion-weighted imaging in meningioma: prediction of tumor grade and association with histopathological parameters. Transl Oncol 2015 Dec;8(6):517-523.
- 26. Lee EJ, terBrugge K, Mikulis D, Choi DS, Bae JM, Lee SK, et al. Diagnostic value of peritumoral minimum apparent diffusion coefficient for differentiation of glioblastoma multiforme from solitary metastatic lesions. AJR Am J Roentgenol 2011 Jan;196(1):71-76.
- 27. Kitis O, Altay H, Calli C, Yunten N, Akalin T, Yurtseven T. Minimum apparent diffusion coefficients in the evaluation of brain tumors. Eur J Radiol 2005 Sep;55(3):393-400.
- 28. Rollin N, Guyotat J, Streichenberger N, Honnorat J, Tran Minh VA, Cotton F. Clinical relevance of diffusion and perfusion magnetic resonance imaging in assessing intra-axial brain tumors. Neuroradiology 2006 Mar;48(3):150-159.
- 29. Schlemmer H-P, Bachert P, Herfarth KK, Zuna I, Debus J, van Kaick G. Proton MR spectroscopic evaluation of suspicious brain lesions after stereotactic radiotherapy. AJNR Am J Neuroradiol 2001 Aug;22(7):1316-1324.
- 30. Sener RN. Longstanding tectal tumors: proton MR spectroscopy and diffusion MRI findings. Comput Med Imaging Graph 2002 Jan-Feb;26(1):25-31.
- 31. Woodhams R, Kakita S, Hata H, Iwabuchi K, Umeoka S, Mountford CE, et al. Diffusion-weighted imaging of mucinous carcinoma of the breast: evaluation of apparent diffusion coefficient and signal intensity in correlation with histologic findings. AJR Am J Roentgenol 2009 Jul;193(1):260-266.
- 32. Sui Y, Wang H, Liu G, Damen FW, Wanamaker C, Li Y, et al. Differentiation of low-and high-grade pediatric brain tumors with high b-value diffusion-weighted MR imaging and a fractional order calculus model. Radiology 2015 Nov;277(2):489-496.
- 33. Sasaki M, Eida S, Sumi M, Nakamura T. Apparent diffusion coefficient mapping for sinonasal diseases: differentiation of benign and malignant lesions. AJNR Am J Neuroradiol 2011 Jun-Jul;32(6):1100-1106.
- 34. Abdel Razek AA, El-Serougy L, Abdelsalam M, Gaballa G, Talaat M. Differentiation of primary central nervous system lymphoma from glioblastoma: quantitative analysis using arterial-spin labeling and diffusion tensor imaging. World Neurosurg 2019 Mar;123:e303-e309.
- 35. Abdel Razek AA, Talaat M, El-Serougy L, Gaballa G, Abdelsalam M. Clinical applications of arterial spin labeling in brain tumors. J Comput Assist Tomogr 2019 Jul/Aug;43(4):525-532.
- 36. Sunwoo L, Yun TJ, You SH, Yoo RE, Kang KM, Choi SH, et al. Differentiation of glioblastoma from brain metastasis: qualitative and quantitative analysis using arterial spin labeling MR imaging. PLoS One 2016 Nov;11(11):e0166662.
- 37. Yamashita K, Yoshiura T, Hiwatashi A, Togao O, Yoshimoto K, Suzuki SO, et al. Arterial spin labeling of hemangioblastoma: differentiation from metastatic brain tumors based on quantitative blood flow measurement. Neuroradiology 2012 Aug;54(8):809-813.
- 38. El-Serougy L, Abdel Razek AA, Ezzat A, Eldawoody H, El-Morsy A. Assessment of diffusion tensor imaging metrics in differentiating low-grade from high-grade gliomas. Neuroradiol J 2016 Oct;29(5):400-407.
- 39. Abdel Razek AA, Talaat M, El-Serougy L, Abdelsalam M, Gaballa G. Differentiating glioblastomas from solitary brain metastases using arterial spin labeling perfusion- and diffusion tensor imaging-derived metrics. World Neurosurg 2019 Jul;127:e593-e598.
- 40. Abdel Razek A, Mossad A, Ghonim M. Role of diffusion-weighted MR imaging in assessing malignant versus benign skull-base lesions. Radiol Med 2011 Feb;116(1):125-132.