Chronic kidney disease (CKD) is an independent risk factor for death, exhibiting an exponential relationship between the severity of renal impairment and mortality risk.1 Additionally, CKD is often comorbid with known cardiovascular disease (CVD) risk factors,2–4 and patients with a combination of these conditions are at an even higher risk of death.5 Reducing the risk of premature mortality is a primary goal of clinicians; therefore, utilizing renal function for prognosis and risk stratification is crucial at both an individual and population level.
Following its rapid economic development, the UAE has experienced a dramatic rise in CKD-related deaths.6 Furthermore, a recent study among UAE nationals showed that renal insufficiency is associated with poor prognosis.7
In the age of precision medicine, risk stratification and mortality prediction in at-risk populations are imperative for implementing personalized interventions and preventive measures in a more evidence-based manner. Over the past decades, several creatinine-based equations have been developed to serve three important functions: to diagnose and classify CKD, to guide dose adjustment of medications, and to assess overall prognosis.8–10 Equations such as the Modification of Diet in Renal Disease (MDRD) Study,11 the Mayo Clinic Quadratic (MCQ) equation,12 the Full Age Spectrum (FAS) equation,13 and the Chronic Kidney Disease Epidemiology Collaboration (CKD-EPI) equation14 estimate the glomerular filtration rate (eGFR), while the Cockcroft-Gault (CG) equation estimates creatinine clearance (CrCl).15
Current guidelines recommend the CKD-EPI equation as the most accurate method for diagnosing and staging CKD across multiple ethnicities.10,16 The original CG formula estimates CrCl (and not GFR) and, therefore, has been found to overestimate GFR in younger and healthier populations but underestimate it in older populations.17,18 However, the body surface area (BSA)-adjusted CG (BSA-CG) formula has been shown to be more accurate in estimating renal function compared with the original CG equation.19 As such, the BSA-CG formula is still widely used in pharmacokinetic trials and clinical practice.20–23
The differential performance of these equations in predicting mortality has been previously assessed in multiple ethnic populations with vascular comorbidities.24–29 In two recent European studies, the CG formula had better accuracy in predicting mortality in patients with vascular risk than the CKD-EPI and MDRD equations.26,28 While, among Chinese patients with diabetes, the CKD-EPI equation showed better prognostic value than the MDRD formula.24 However, the creatinine-based equation of choice for predicting adverse prognosis and risk estimation among individuals of Arab descent remains unclear. Therefore, this study aimed to investigate and compare the long-term prognostic abilities of several widely used creatinine-based equations in predicting mortality among UAE nationals with CVD risk.
Methods
A retrospective cohort study design was employed to evaluate our research hypothesis by analyzing data from the electronic medical records of the outpatient clinics of Tawam Hospital in Al Ain, UAE. We enrolled consecutive Emirati patients aged ≥ 18 years from 1 April to 31 December 2008, who had one of the following baseline conditions: a history of dyslipidemia, smoking, CVD, systolic blood pressure (SBP) ≥ 120 mmHg, diastolic blood pressure (DBP) ≥ 80 mmHg, serum glycated hemoglobin (HbA1c) level ≥ 5.7%, body mass index (BMI) ≥ 25 kg/m2, and receiving antidiabetic or antihypertensive medications. Data were collected at the baseline visits in 2008 and follow-up visits until 30 September 2018. Patients who had been receiving dialysis at baseline or those who underwent kidney transplants were excluded, due to potential inaccuracies in CrCl estimation. Patients with incomplete data on height, weight, and serum creatinine levels, and those without a follow-up clinic visit other than the baseline visit were also excluded.
The study protocol was approved by the institutional review board of Tawam Hospital and the UAE University (IRR536/17), and the requirement for informed consent was waived.
Sociodemographic data collected at baseline included age, sex, and history of smoking. Anthropometric information included height, weight, SBP, and DBP. Laboratory parameters included HbA1c, serum triglyceride (TG), serum low-density lipoprotein-cholesterol (LDL-C), serum high-density lipoprotein-cholesterol (HDL-C), serum total cholesterol (TC), and serum creatinine (SCr) levels. Pharmacological treatment included the use of antihypertensive agents, lipid-lowering medications, and antidiabetic drugs.
All laboratory tests were performed at Tawam Hospital. SCr levels were assayed using the kinetic Jaffé method on the Synchron® Clinical System (UniCel® DxC-800; Beckman Coulter, Inc., Fullerton, CA). The Jaffé method offers traceability and calibration to a reference method, i.e., isotope dilution mass spectrometry (ID/MS). The manufacturer’s suggested reference ranges for SCr level were 53–115 µmol/L (0.60–1.30 mg/dL) and 58–96 µmol/L (0.66–1.09 mg/dL) for men and women, respectively.
In our study, eGFR and CrCl values were determined based on SCr (µmol/L), height (cm), weight (kg), and age (years), using the CKD-EPI,14 ID/MS-traceable version of the MDRD,11 CG,15 MCQ,12 and FAS equations.13 The CG equation, which assessed CrCl that was not expressed by the unit (mL/min/1.73 m2), was adjusted by multiplying the obtained values with 1.73 m2 and dividing the products by the patients’ BSA (BSA-CG).19 BSA was calculated using the DuBois formula30: 0.007184 × weight (kg)0.425 × height (cm) 0.725
The patients were classified according to their eGFR and CrCl values into CKD stages as per the National Kidney Foundation Kidney Disease Outcomes Quality Initiative clinical practice guidelines: stage 1) eGFR ≥ 90, stage 2) eGFR 60 to 89.99, stage 3a) eGFR 45 to 59.99, stage 3b) eGFR 30 to 44.99, stage 4) eGFR 15 to 29.99, and stage 5) eGFR < 15 in mL/min/1.73 m2.10
Hypertension (HTN) was defined by SBP values ≥ 140 mm Hg, DBP ≥ 90 mm Hg, or by the use of antihypertensive medications.31 Dyslipidemia was defined by one or more of the following: HDL-C < 1.03 mmol/L, TC ≥ 5.17 mmol/L, LDL-C ≥ 3.36 mmol/L, TG ≥ 1.69 mmol/L, or documented treatment with lipid-lowering drugs.32 Patients receiving antidiabetic medications or with an HbA1c level of ≥ 6.5% were considered to have type 2 diabetes (T2DM).33 Smoking history was considered positive if there was a current habit or history of using tobacco products. Obesity was defined as BMI ≥ 30 kg/m2. History of CVD was defined as a documented diagnosis of peripheral arterial disease, stroke, or coronary artery disease. Patients were considered as having a history of cancer if they had an established diagnosis from any type of malignancy. The primary outcome, all-cause mortality, was defined as death from any cause and was confirmed by a review of death certificates and clinical records.
Data were expressed as mean±standard deviation (SD), as a percentage, or as median [interquartile range (IQR)]. The baseline characteristics of deceased and alive subjects were compared using Fisher’s exact test (two-tailed) for categorical variables, the independent samples t-test for normally distributed continuous variables, and the Mann-Whitney U test for non-normally distributed continuous variables.
The univariable Kaplan-Meier survival analysis and the log-rank test were used to compare the survival functions across different CKD stages for each eGFR and CrCl equation. Univariable and multivariable Cox proportional hazards models were used to estimate the hazard ratios (HRs) for all-cause mortality of the different eGFR and CrCl equations. HRs were adjusted for sex, age (categories), CVD, DM, HTN, history of smoking, dyslipidemia, obesity, and cancer to reduce the effect of other confounding variables on mortality. The proportional hazards assumption was evaluated using log-log plots and were not significant. Multi collinearity was assessed by examining the tolerance, and values > 0.2 indicated an absence of multi collinearity within the survival models. The results are reported as HRs and 95% confidence interval (CI).
The prognostic discrimination of each eGFR and CrCl estimate in predicting all-cause mortality was tested by calculating the C-indices using the “survival” package in R software.34 A C-index ranges from 0.5 to 1, with a value of 1 considered as perfect discrimination. The C-indices from each eGFR and CrCl equation were compared with the CKD-EPI equation using the ‘CompareC’ package in R.35 A larger increase in the C-index suggested a better discriminatory value. Integrated discrimination improvement (IDI) and net reclassification improvement (NRI) were calculated to compare the predictive accuracy of CKD stage estimates between each eGFR and CrCl equation and the CKD-EPI formula with respect to all-cause mortality. The IDI and NRI assess the ability of a given model to appropriately or inappropriately reclassify patients into lower or higher levels of risk as compared with another model.36 IDI and NRI were analyzed using the package ‘survIDINRI’ in R.37
All statistical analyses were performed using R software version 3.5.2 (The R Foundation, Vienna, Austria) and IBM®SPSS® software, version 25 (IBM Corporation, Armonk, NY, USA). Two-tailed p-values < 0.050 were considered statistically significant.
Results
A total of 1216 patients met the inclusion criteria. Of these, 16 had missing values on one or more baseline variables required to estimate eGFR and CrCl (SCr, height, or weight), 10 had received a kidney transplant or had been receiving dialysis, and four patients did not have a follow-up clinic visit other than the baseline visit and were excluded from the study. The baseline characteristics of the remaining 1186 patients included in the analyses are presented in Table 1. With a median follow-up of 8.9 years (IQR = 7.8–9.6 years), there were 112 deaths (9.4%) in the entire cohort. Of these deaths, 44 (39.3%) were due to coronary heart disease and stroke. At baseline, the mean age of the population was 52.4±15.6 years, of which 54.0% were men. Almost half of the cohort had DM, and approximately two-thirds had HTN. Approximately 81% had dyslipidemia, and nearly 17% had CVD at baseline. About 10% of patients were categorized as CKD stages 3–5 by the CKD-EPI formula. Those who died over the follow-up period were older at baseline; were more likely to be men; more frequently had a history of DM, HTN, CVD, and cancer; but less frequently had a history of obesity than survivors. As expected, those who died during follow-up had lower eGFR and CrCl values than survivors as calculated by all the creatinine-based equations at baseline.
Table 1: Comparison of the patients’ baseline characteristics according to all-cause mortality.
|
Age, mean ± SD, years |
52.4 ± 15.6 |
50.8 ± 15.0 |
67.8 ± 11.4 |
< 0.001 |
|
Age, n (%), years |
|
|
|
|
|
≤ 39 |
280 (23.6) |
275 (25.6) |
5 (4.5) |
< 0.001 |
|
40–54 |
334 (28.2) |
326 (30.4) |
8 (7.1) |
|
|
55–64 |
277 (23.4) |
260 (24.2) |
17 (15.2) |
|
|
≥ 65 |
295 (24.9) |
213 (19.8) |
82 (73.2) |
|
|
Sex, male, n (%) |
641 (54.0) |
565 (52.6) |
76 (67.9) |
0.002 |
|
Comorbidities, n (%) |
|
|
|
|
|
Smoking history |
227 (19.1) |
199 (18.5) |
28 (25.0) |
0.102 |
|
Obesity |
525 (44.3) |
491 (45.7) |
34 (30.4) |
0.002 |
|
DM |
570 (48.1) |
489 (45.5) |
81 (72.3) |
< 0.001 |
|
HTN |
794 (66.9) |
697 (64.9) |
97 (86.6) |
< 0.001 |
|
Dyslipidemia |
960 (80.9) |
864 (80.4) |
96 (85.7) |
0.206 |
|
CVD |
197 (16.6) |
140 (13.0) |
57 (50.9) |
< 0.001 |
|
Cancer |
75 (6.3) |
57 (5.3) |
18 (16.1) |
< 0.001 |
|
Renal function |
|
|
|
|
|
SCr (µmol/L), median (IQR) |
69.00 (56.00–84.25) |
67.00 (55.00–81.00) |
93.00 (70.25–125.25) |
< 0.001 |
|
SCr (mg/dL), median (IQR) |
0.78 (0.63–0.95) |
0.76 (0.62–0.92) |
1.05 (0.79–1.42) |
< 0.001 |
|
CKD-EPI (mL/min/1.73 m2), mean ± SD |
94.8 ± 23.5 |
97.8 ± 21.3 |
66.7 ± 24.8 |
< 0.001 |
|
MDRD (mL/min/1.73 m2), mean ± SD |
96.0 ± 31.5 |
98.9 ± 30.0 |
68.7 ± 33.1 |
< 0.001 |
|
BSA-CG (mL/min/1.73 m2), mean ± SD |
112.0 ± 44.2 |
116.8 ± 42.6 |
65.7 ± 30.2 |
< 0.001 |
|
MCQ (mL/min/1.73 m2), mean ± SD |
104.0 ± 23.5 |
106.8 ± 21.2 |
77.9 ± 27.7 |
< 0.001 |
BSA-CG: body surface area-adjusted Cockcroft-Gault; CKD-EPI: Chronic Kidney Disease Epidemiology Collaboration; CVD: cardiovascular disease; DM: diabetes mellitus; FAS: Full Age Spectrum; HTN: hypertension; IQR: interquartile range; MCQ: Mayo Clinic Quadratic; MDRD: Modification of Diet in Renal Disease Study; SCr: serum creatinine; SD: standard deviation.
aThe independent samples t-test was used to calculate the p-values for continuous variables, and Fisher’s exact test (two-tailed) for categorical variables. The Mann-Whitney U test was used to compare the median values of SCr levels.
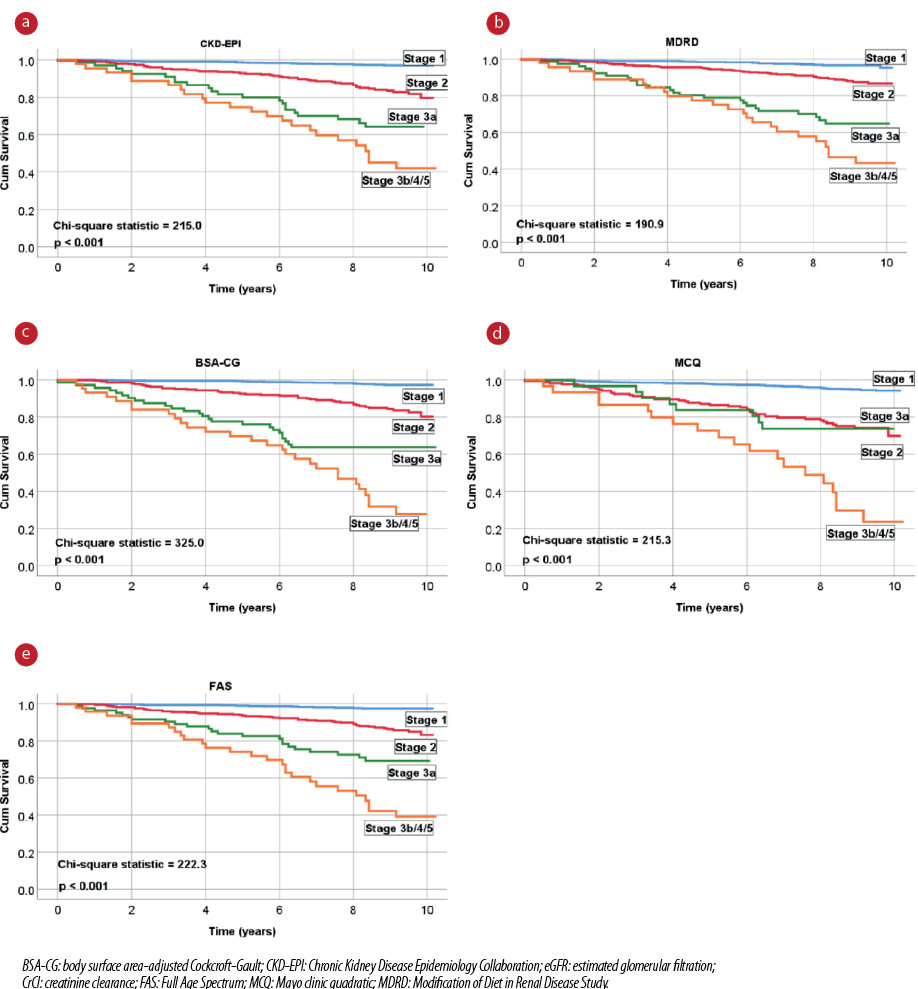
Figure 1: Unadjusted Kaplan-Meier survival curves for all-cause mortality according to the different eGFR and CrCl equations.
Table 2: Hazard ratios (HRs) for the association of eGFR and CrCl with all-cause mortality.
|
CKD-EPI |
|
|
|
|
|
Stage 1 |
Reference |
|
Reference |
|
|
Stage 2 |
6.25 (3.70–10.55) |
< 0.001 |
2.44 (1.31–4.55) |
0.005 |
|
Stage 3a |
15.02 (8.20–27.54) |
< 0.001 |
5.93 (2.92–12.03) |
< 0.001 |
|
Stage 3b/4/5 |
25.41 (13.94–46.29) |
< 0.001 |
7.31 (3.56–15.03) |
< 0.001 |
|
MDRD |
|
|
|
|
|
Stage 1 |
Reference |
|
Reference |
|
|
Stage 2 |
3.52 (2.09–5.92) |
< 0.001 |
2.03 (1.17–3.54) |
0.012 |
|
Stage 3a |
12.10 (6.77–21.62) |
< 0.001 |
5.55 (2.95–10.44) |
< 0.001 |
|
Stage 3b/4/5 |
19.92 (11.02–36.01) |
< 0.001 |
5.98 (3.10–11.54) |
< 0.001 |
|
BSA-CG |
|
|
|
|
|
Stage 1 |
Reference |
|
Reference |
|
|
Stage 2 |
7.08 (4.03–12.44) |
< 0.001 |
3.16 (1.49–6.72) |
0.003 |
|
Stage 3a |
19.79 (10.68–36.67) |
< 0.001 |
8.18 (3.63–18.44) |
< 0.001 |
|
Stage 3b/4/5 |
42.02 (22.96–76.88) |
< 0.001 |
13.49 (5.75–31.66) |
< 0.001 |
|
MCQ |
|
|
|
|
|
Stage 1 |
Reference |
|
Reference |
|
|
Stage 2 |
5.75 (3.76–8.80) |
< 0.001 |
3.04 (1.84–5.02) |
< 0.001 |
|
Stage 3a |
5.81 (2.73–12.35) |
< 0.001 |
2.45 (1.11–5.40) |
0.026 |
|
Stage 3b/4/5 |
19.40 (11.28–33.36) |
< 0.001 |
6.23 (3.41–11.37) |
< 0.001 |
|
FAS |
|
|
|
|
|
Stage 1 |
Reference |
|
Reference |
|
|
Stage 2 |
5.91 (3.31–10.55) |
< 0.001 |
2.42 (1.17–4.97) |
0.017 |
|
Stage 3a |
14.83 (7.74–28.43) |
< 0.001 |
4.94 (2.20–11.11) |
< 0.001 |
BSA-CG: body surface area-adjusted Cockcroft-Gault; CKD-EPI: Chronic Kidney Disease Epidemiology Collaboration; CVD: cardiovascular disease; DM: diabetes mellitus; FAS: Full Age Spectrum; HTN: hypertension; MCQ: Mayo Clinic quadratic; MDRD: Modification of Diet in Renal Disease Study; CI: confidence interval; eGFR: estimated glomerular filtration; CrCl: creatinine clearance.
aMultivariable Cox model adjusted for age (categories), sex, CVD, DM, HTN, history of smoking, dyslipidemia, obesity, and cancer.
Table 3: Discriminative abilities of eGFR and CrCl equations for predicting all-cause mortality.
|
CKD-EPI |
0.779 ± 0.022 |
Reference |
|
0.861 ± 0.016 |
Reference |
|
|
MDRD |
0.753 ± 0.023 |
-0.026 |
0.059 |
0.863 ± 0.015 |
0.002 |
0.567 |
|
BSA-CG |
0.816 ± 0.020 |
0.037 |
0.004 |
0.869 ± 0.016 |
0.008 |
0.037 |
|
MCQ |
0.728 ± 0.024 |
-0.051 |
0.003 |
0.856 ± 0.017 |
-0.005 |
0.184 |
BSA-CG: body surface area-adjusted Cockcroft-Gault; CKD-EPI: Chronic Kidney Disease Epidemiology Collaboration; CVD: cardiovascular disease; DM: diabetes mellitus; FAS: Full Age Spectrum; HTN: hypertension; MCQ: Mayo Clinic quadratic; MDRD: Modification of Diet in Renal Disease Study; eGFR: estimated glomerular filtration; CrCl: creatinine clearance.
aMultivariable Cox model adjusted for age (categories), sex, CVD, DM, HTN, history of smoking, dyslipidemia, obesity, and cancer.
Table 4: Reclassification performance of eGFR and CrCl equations for predicting all-cause mortality, based on IDI after multivariable adjustmenta.
|
CKD-EPI |
Reference |
|
|
MDRD |
-0.014 (-0.060–0.020) |
0.416 |
|
BSA-CG |
0.087 (0.029–0.147) |
0.008 |
|
MCQ |
-0.029 (-0.079–0.014) |
0.172 |
BSA-CG: body surface area-adjusted Cockcroft-Gault; CI: confidence interval; CKD-EPI: Chronic Kidney Disease Epidemiology Collaboration; CrCl: creatinine clearance. eGFR: estimated glomerular filtration; FAS: Full Age Spectrum; IDI: integrated discrimination increment; MCQ: Mayo Clinic quadratic; MDRD: Modification of Diet in Renal Disease Study.
aMultivariable Cox model adjusted for age (categories), sex, cardiovascular disease, diabetes mellitus, hypertension, history of smoking, dyslipidemia, obesity, and cancer.
Unadjusted long-term Kaplan-Meier survival curves of the eGFR and CrCl equations are presented in Figure 1. The survival distributions of all equations were significantly different (log-rank test, p < 0.001). However, the CKD stages diverged more noticeably with the BSA-CG equation (higher chi-square values). In the adjusted Cox regression analyses, all five eGFR and CrCl equations were significantly associated with all-cause mortality for the higher-severity renal function stages (CKD stages ≥ 3) compared to CKD stage 1 (reference category) [Table 2].
Results of the analysis of the discriminative abilities for predicting all-cause mortality among high-risk UAE nationals are shown in Table 3. In the unadjusted models, when compared with the CKD-EPI equation (C-index: 0.779), MDRD and FAS equations did not have better discriminative abilities. The MCQ equation discriminated poorly, whereas the BSA-CG equation had the best discrimination (C-index: 0.816; p = 0.004). Even after adjustment for other confounding variables (age, sex, CVD, DM, HTN, history of smoking, dyslipidemia, obesity, and cancer), the BSA-CG equation was the most accurate in predicting all-cause mortality. In addition, this study demonstrated a significant increase in the NRI and IDI with the BSA-CG equation when compared with the CKD-EPI equation after multivariable adjustment. In contrast, no significant differences were observed among the MDRD, MCQ, and FAS equations for predicting all-cause mortality [Table 4 and Figure 2].
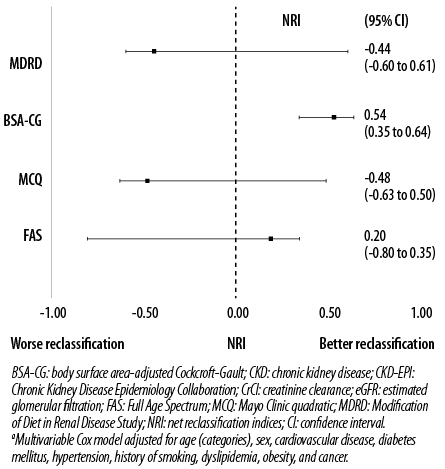
Figure 2: NRI of different eGFR and CrCl equations compared with CKD-EPI formula using CKD stages after multivariable adjustmenta.
Discussion
The BSA-CG formula performed slightly better than the CKD-EPI equation with respect to both discriminative ability and reclassification for predicting all-cause mortality in this high-risk Emirati population. It must be emphasized that our study’s aim was not to accurately determine the renal function to classify kidney failure but rather to assess the prognostic value of different renal function formulas on all-cause mortality in our cohort of patients with vascular risk.
Predicting prognosis using renal function has been extensively studied in different populations,24–29 but the formula of choice for mortality prediction has yet to be definitively established. Studies have shown that the CKD-EPI formula outperforms the CG and MDRD equations in accuracy and precision when estimating GFR,10,14 particularly in population-based studies. Therefore, it would logically follow that calculating the renal function using the CKD-EPI equation would also prognosticate and predict mortality more accurately than other formulas. Surprisingly, when we compared the discriminative abilities for predicting all-cause mortality among high-risk UAE nationals, the BSA-CG formula had significantly better discrimination than the CKD-EPI formula (C-indices: 0.869 vs. 0.861, p = 0.037, respectively). Moreover, compared to the CKD-EPI equation, the NRI value of the BSA-CG formula was significantly positive for all-cause mortality. Similar results were also seen in previous studies assessing predictive outcomes in patients with vascular risk.26,28,29,38 In the Heart Omics in Ageing (HOMAGE) study, the BSA-CG equation was slightly more accurate in predicting cardiovascular disease mortality in patients with CVD risk.26 In addition, a large Swedish cohort study in patients with heart failure found that the CG (BSA unadjusted) equation predicted mortality most accurately compared with the CKD-EPI and MDRD equations.28 Similar results were noted in a recent study on patients with acute coronary syndrome, in which the BSA-CG and FAS equations were superior in predicting one-year mortality compared to the CKD-EPI equation.29
Our study results may be explained by the difficulty for a direct comparison between the CKD-EPI and CG formulas. For example, the CKD-EPI equation measures the relative renal function, while the CG formula measures the absolute renal function. In addition, unlike the CKD-EPI formula, the CG equation includes the anthropometric measurement of weight in the calculation. It has been shown that obesity increases the risk of developing diabetes and HTN,39 and close to half and two-thirds of our study population had these comorbidities, respectively. Collectively these vascular risk factors have a direct effect by increasing the risk for kidney disease40 and all-cause mortality in these patients.41 Furthermore, the CG equation is a better predictor of renal function in overweight and obese patients with vascular comorbidities than the CKD-EPI formula.42 With close to half of our study participants being obese at baseline, it could possibly explain why the BSA-CG equation is a relatively better predictor of mortality in our population than the CKD-EPI formula. Moreover, despite adjusting for obesity, the BSA-CG equation remained the best predictor of all-cause mortality.
The findings from this and recent large cohort studies suggest that the BSA-CG equation can improve long-term prediction of mortality in high-risk patients compared to the currently recommended CKD-EPI formula.26,28,29 Therefore, the BSA-CG equation may have some clinical and research implications as a prognostic indicator in this high-risk population.
To the best of our knowledge, this is the first study that compares the prognostic abilities of different creatinine-based eGFR and CrCl equations in Emirati patients with vascular risk over a nine-year period. In addition, this study used recorded anthropometric and laboratory data rather than self-reported measurements to classify
risk factors.
This study has several limitations. First, our study’s purpose was to assess eGFR and CrCl equations for the prediction of all-cause mortality and not to identify which formula most accurately predicts true GFR. Thus, the method to best measure true GFR cannot be determined from our study. Second, data on other prognostic CKD markers for mortality, such as albuminuria or cystatin-C, were unavailable and could have affected the study results. Finally, changes in creatinine levels from baseline were not accounted for during the follow-up period, which could have affected the predictive abilities of the different eGFR and CrCl equations.
Conclusion
Knowing the formula that performs best prognostically in our at-risk population may help better define those at the highest risk and decide on the most appropriate treatment plans and interventions. Our study results suggest that the BSA-CG equation may have the potential to improve mortality prediction slightly in Emirati patients with vascular risk and could potentially have a prognostic role in these patients in everyday clinical practice or research. However, further large multicenter studies from the region are warranted to confirm our findings.
Disclosure
The authors declared no conflicts of interest. This work was supported by the College of Medicine and Health Sciences, United Arab Emirates University (grant number 31M325). The funders had no role in study design, data collection, and analysis, decision to publish, or preparation of the manuscript. Data are available in a public, open-access repository. Supplementary data and analysis can be accessed from the Mendeley repository (http://dx.doi.org/10.17632/ppfwfpprbc.1). All data have been provided in the study and anyone is permitted to use the data provided that the article is properly cited.
references
- 1. Tonelli M, Wiebe N, Culleton B, House A, Rabbat C, Fok M, et al. Chronic kidney disease and mortality risk: a systematic review. J Am Soc Nephrol 2006 Jul;17(7):2034-2047.
- 2. Salinero-Fort MA, San Andrés-Rebollo FJ, de Burgos-Lunar C, Gómez-Campelo P, Chico-Moraleja RM, López de Andrés A, et al; MADIABETES Group. Five-year incidence of chronic kidney disease (stage 3-5) and associated risk factors in a Spanish cohort: the MADIABETES Study. PLoS One 2015 Apr;10(4):e0122030.
- 3. Al-Shamsi S, Regmi D, Govender RD. Chronic kidney disease in patients at high risk of cardiovascular disease in the United Arab Emirates: A population-based study. PLoS One 2018 Jun;13(6):e0199920.
- 4. Panduranga P, Al-Rashidi M, Al-Hajri F. In-hospital and one-year clinical outcome of percutaneous coronary intervention in a tertiary hospital in Oman: Oman PCI Registry. Oman Med J 2017 Jan;32(1):54-61.
- 5. Muntner P, He J, Hamm L, Loria C, Whelton PK. Renal insufficiency and subsequent death resulting from cardiovascular disease in the United States. J Am Soc Nephrol 2002 Mar;13(3):745-753.
- 6. United Arab Emirates. In: Institute for Health Metrics and Evaluation [Internet]. 9 Sep 2015 [cited 18 Nov 2019]. Available from: http://www.healthdata.org/united-arab-emirates.
- 7. Al-Shamsi S, Regmi D, Govender RD. Incidence of cardiovascular disease and its associated risk factors in at-risk men and women in the United Arab Emirates: a 9-year retrospective cohort study. BMC Cardiovasc Disord 2019 Jun;19(1):148.
- 8. Levey AS, Eckardt KU, Tsukamoto Y, Levin A, Coresh J, Rossert J, et al. Definition and classification of chronic kidney disease: a position statement from Kidney Disease: Improving Global Outcomes (KDIGO). Kidney Int 2005 Jun;67(6):2089-2100.
- 9. Levey AS, de Jong PE, Coresh J, El Nahas M, Astor BC, Matsushita K, et al. The definition, classification, and prognosis of chronic kidney disease: a KDIGO Controversies Conference report. Kidney Int 2011 Jul;80(1):17-28.
- 10. Levin A, Stevens PE, Bilous RW, et al. Kidney disease: Improving global outcomes (KDIGO) CKD work group. KDIGO 2012 clinical practice guideline for the evaluation and management of chronic kidney disease. Kidney Int Suppl 2013;3:1-150.
- 11. Levey AS, Coresh J, Greene T, Stevens LA, Zhang YL, Hendriksen S, et al; Chronic Kidney Disease Epidemiology Collaboration. Using standardized serum creatinine values in the modification of diet in renal disease study equation for estimating glomerular filtration rate. Ann Intern Med 2006 Aug;145(4):247-254.
- 12. Rule AD, Larson TS, Bergstralh EJ, Slezak JM, Jacobsen SJ, Cosio FG. Using serum creatinine to estimate glomerular filtration rate: accuracy in good health and in chronic kidney disease. Ann Intern Med 2004 Dec;141(12):929-937.
- 13. Pottel H, Hoste L, Dubourg L, Ebert N, Schaeffner E, Eriksen BO, et al. An estimated glomerular filtration rate equation for the full age spectrum. Nephrol Dial Transplant 2016 May;31(5):798-806.
- 14. Levey AS, Stevens LA, Schmid CH, Zhang YL, Castro AF III, Feldman HI, et al; CKD-EPI (Chronic Kidney Disease Epidemiology Collaboration). A new equation to estimate glomerular filtration rate. Ann Intern Med 2009 May;150(9):604-612.
- 15. Cockcroft DW, Gault MH. Prediction of creatinine clearance from serum creatinine. Nephron 1976;16(1):31-41.
- 16. Stevens LA, Claybon MA, Schmid CH, Chen J, Horio M, Imai E, et al. Evaluation of the Chronic Kidney Disease Epidemiology Collaboration equation for estimating the glomerular filtration rate in multiple ethnicities. Kidney Int 2011 Mar;79(5):555-562.
- 17. Selistre L, De Souza V, Cochat P, Antonello IC, Hadj-Aissa A, Ranchin B, et al. GFR estimation in adolescents and young adults. J Am Soc Nephrol 2012 Jun;23(6):989-996.
- 18. Dowling TC, Wang ES, Ferrucci L, Sorkin JD. Glomerular filtration rate equations overestimate creatinine clearance in older individuals enrolled in the Baltimore Longitudinal Study on Aging: impact on renal drug dosing. Pharmacotherapy 2013 Sep;33(9):912-921.
- 19. Rostoker G, Andrivet P, Pham I, Griuncelli M, Adnot S. A modified Cockcroft-Gault formula taking into account the body surface area gives a more accurate estimation of the glomerular filtration rate. J Nephrol 2007 Sep-Oct;20(5):576-585.
- 20. Casal MA, Nolin TD, Beumer JH. Estimation of kidney function in oncology: implications for anticancer drug selection and dosing. Clin J Am Soc Nephrol 2019 Apr;14(4):587-595.
- 21. Glatard A, Bourguignon L, Jelliffe RW, Maire P, Neely MN, Goutelle S. Influence of renal function estimation on pharmacokinetic modeling of vancomycin in elderly patients. Antimicrob Agents Chemother 2015;59(6):2986-2994.
- 22. Charhon N, Neely MN, Bourguignon L, Maire P, Jelliffe RW, Goutelle S. Comparison of four renal function estimation equations for pharmacokinetic modeling of gentamicin in geriatric patients. Antimicrob Agents Chemother 2012 Apr;56(4):1862-1869.
- 23. Body surface area for adjustment of drug dose. Drug Ther Bull 2010 Mar;48(3):33-36.
- 24. Lee CH, Shih AZ, Woo YC, Fong CH, Yuen MM, Chow WS, et al. Which creatinine-based estimated glomerular filtration rate equation best predicts all-cause mortality in Chinese subjects with type 2 diabetes? Diabetes Res Clin Pract 2017 Apr;126:25-29.
- 25. Matsushita K, Mahmoodi BK, Woodward M, Emberson JR, Jafar TH, Jee SH, et al; Chronic Kidney Disease Prognosis Consortium. Comparison of risk prediction using the CKD-EPI equation and the MDRD study equation for estimated glomerular filtration rate. JAMA 2012 May;307(18):1941-1951.
- 26. Ferreira JP, Girerd N, Pellicori P, Duarte K, Girerd S, Pfeffer MA, et al; Heart ‘OMics’ in AGEing (HOMAGE) initiative and the High-Risk Myocardial Infarction database initiative. Renal function estimation and Cockroft-Gault formulas for predicting cardiovascular mortality in population-based, cardiovascular risk, heart failure and post-myocardial infarction cohorts: The Heart ‘OMics’ in AGEing (HOMAGE) and the high-risk myocardial infarction database initiatives. BMC Med 2016 Nov;14(1):181.
- 27. Ballo P, Chechi T, Spaziani G, Fibbi V, Conti D, Ferro G, et al. Prognostic comparison between creatinine-based glomerular filtration rate formulas for the prediction of 10-year outcome in patients with non-ST elevation acute coronary syndrome treated by percutaneous coronary intervention. Eur Heart J Acute Cardiovasc Care 2018 Dec;7(8):689-702.
- 28. Szummer K, Evans M, Carrero JJ, Alehagen U, Dahlström U, Benson L, et al. Comparison of the chronic kidney disease epidemiology collaboration, the modification of diet in renal disease study and the Cockcroft-Gault equation in patients with heart failure. Open Heart 2017 Jun;4(2):e000568.
- 29. Bataille Y, Costerousse O, Bertrand OF, Moranne O, Pottel H, Delanaye P. One-year mortality of patients with ST-Elevation myocardial infarction: Prognostic impact of creatinine-based equations to estimate glomerular filtration rate. PLoS One 2018 Jul;13(7):e0199773.
- 30. Du Bois D, Du Bois EF. A formula to estimate the approximate surface area if height and weight be known. 1916. Nutr Burbank Los Angel Cty Calif. 1989; 5: 303-311; discussion 312-313.
- 31. National High Blood Pressure Education Program. The Seventh Report of the Joint National Committee on Prevention, Detection, Evaluation, and Treatment of High Blood Pressure. Bethesda (MD): National Heart, Lung, and Blood Institute (US). 2004 [cited 25 Jun 2019]. Available from: http://www.ncbi.nlm.nih.gov/books/NBK9630/.
- 32. Expert Panel on Detection, Evaluation, and Treatment of High Blood Cholesterol in Adults. Executive Summary of The Third Report of The National Cholesterol Education Program (NCEP) Expert Panel on Detection, Evaluation, And Treatment of High Blood Cholesterol In Adults (Adult Treatment Panel III). JAMA 2001 May;285(19):2486-2497.
- 33. American Diabetes Association. Diagnosis and classification of diabetes mellitus. Diabetes Care 2010 Jan;33(Suppl 1):S62-S69.
- 34. Therneau TM. TL (original S->R port and R maintainer. survival: Survival Analysis. 2018 [cited 25 Jun 2019]. Available from: https://CRAN.R-project.org/package=survival.
- 35. Kang L, Chen W, Petrick NA, Gallas BD. Comparing two correlated C indices with right-censored survival outcome: a one-shot nonparametric approach. Stat Med 2015 Feb;34(4):685-703.
- 36. Leening MJ, Vedder MM, Witteman JC, Pencina MJ, Steyerberg EW. Net reclassification improvement: computation, interpretation, and controversies: a literature review and clinician’s guide. Ann Intern Med 2014 Jan;160(2):122-131.
- 37. Uno H, Cai T. survIDINRI: IDI and NRI for comparing competing risk prediction models with censored survival data. 2013 [cited 25 Jun 2019]. Available from: https://CRAN.R-project.org/package=survIDINRI.
- 38. Zamora E, Lupón J, Vila J, Urrutia A, de Antonio M, Sanz H, et al. Estimated glomerular filtration rate and prognosis in heart failure: value of the Modification of Diet in Renal Disease Study-4, chronic kidney disease epidemiology collaboration, and cockroft-gault formulas. J Am Coll Cardiol 2012 May;59(19):1709-1715.
- 39. Patel SA, Ali MK, Alam D, Yan LL, Levitt NS, Bernabe-Ortiz A, et al. Obesity and its relation with diabetes and hypertension: a cross-sectional study across 4 geographical regions. Glob Heart 2016 Mar;11(1):71-79.e4.
- 40. Hsu CY, McCulloch CE, Iribarren C, Darbinian J, Go AS. Body mass index and risk for end-stage renal disease. Ann Intern Med 2006 Jan;144(1):21-28.
- 41. Aune D, Sen A, Prasad M, Norat T, Janszky I, Tonstad S, et al. BMI and all cause mortality: systematic review and non-linear dose-response meta-analysis of 230 cohort studies with 3.74 million deaths among 30.3 million participants. BMJ 2016 May;353:i2156.
- 42. Drion I, Joosten H, Santing L, Logtenberg SJ, Groenier KH, Lieverse AG, et al. The Cockcroft-Gault: a better predictor of renal function in an overweight and obese diabetic population. Obes Facts 2011;4(5):393-399.